Bitcoin (BTC) created a long lower wick after bouncing at the $44,000 horizontal support area.
Ethereum (ETH) and XRP (XRP) are trading above horizontal support levels.
Near Protocol (NEAR) reached a new all-time high price on Sept 9.
Hedera Hashgraph (HBAR) has broken out from a long-term descending parallel channel.
Raydium (RAY) has bounced at the $10 horizontal support area.
Elrond (EGLD) has broken out from an ascending parallel channel.
BTC
After reaching a high of $52,950, BTC dropped on Sept 7 and reached a low of $42,483 the same day. However, it bounced back after reaching support and created a long lower wick (green arrow).
Due to the bounce, BTC validated the Supertrend line (green) and the $44,000 horizontal area as support.
However, technical indicators have turned bearish. The MACD is negative and the RSI is below 50.
Therefore, even though BTC is holding above support, technical indicators are turning bearish. 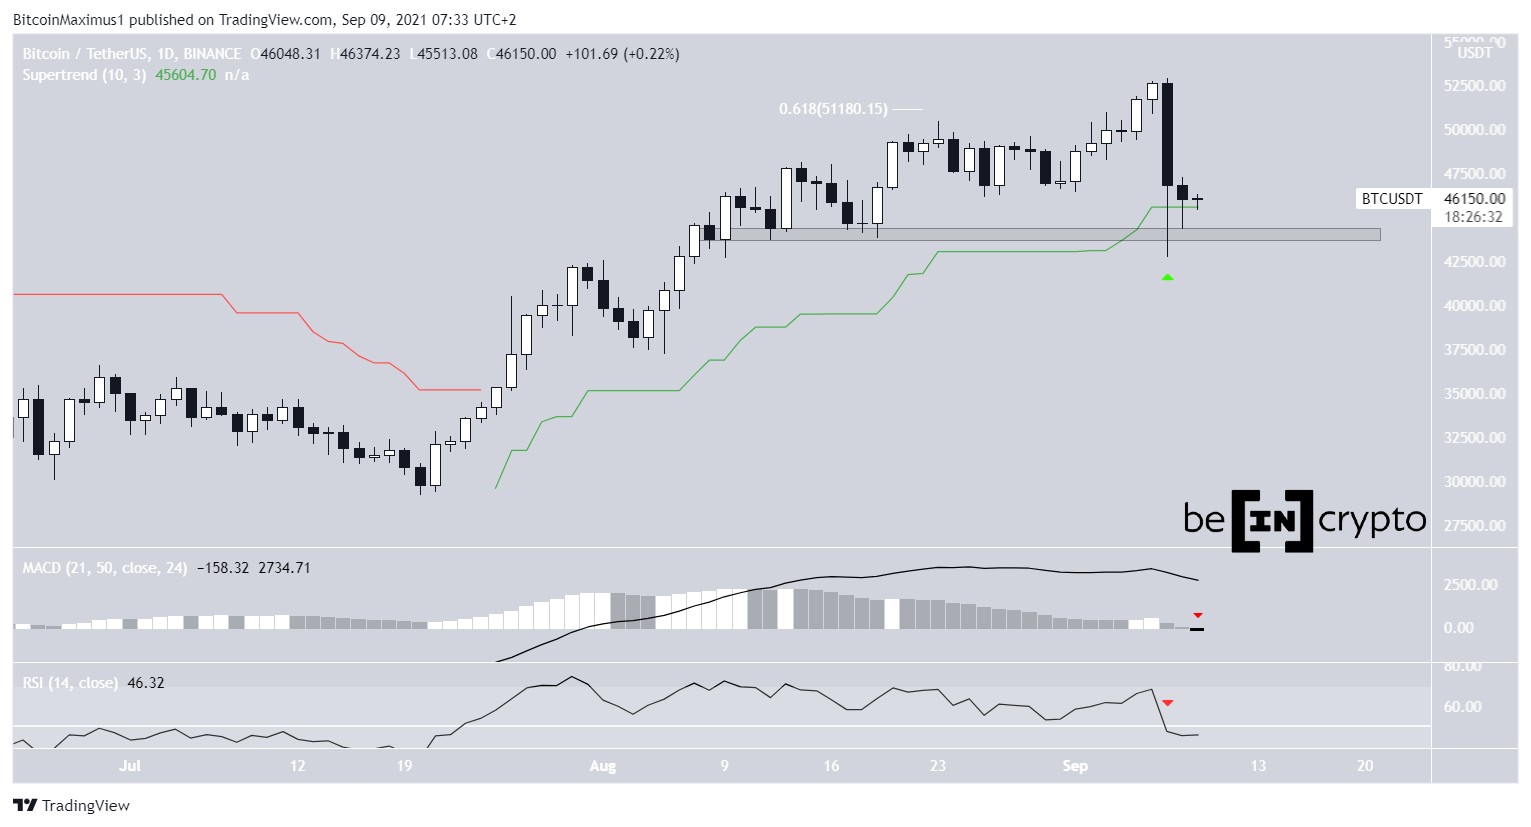
BTC Chart By TradingView
ETH
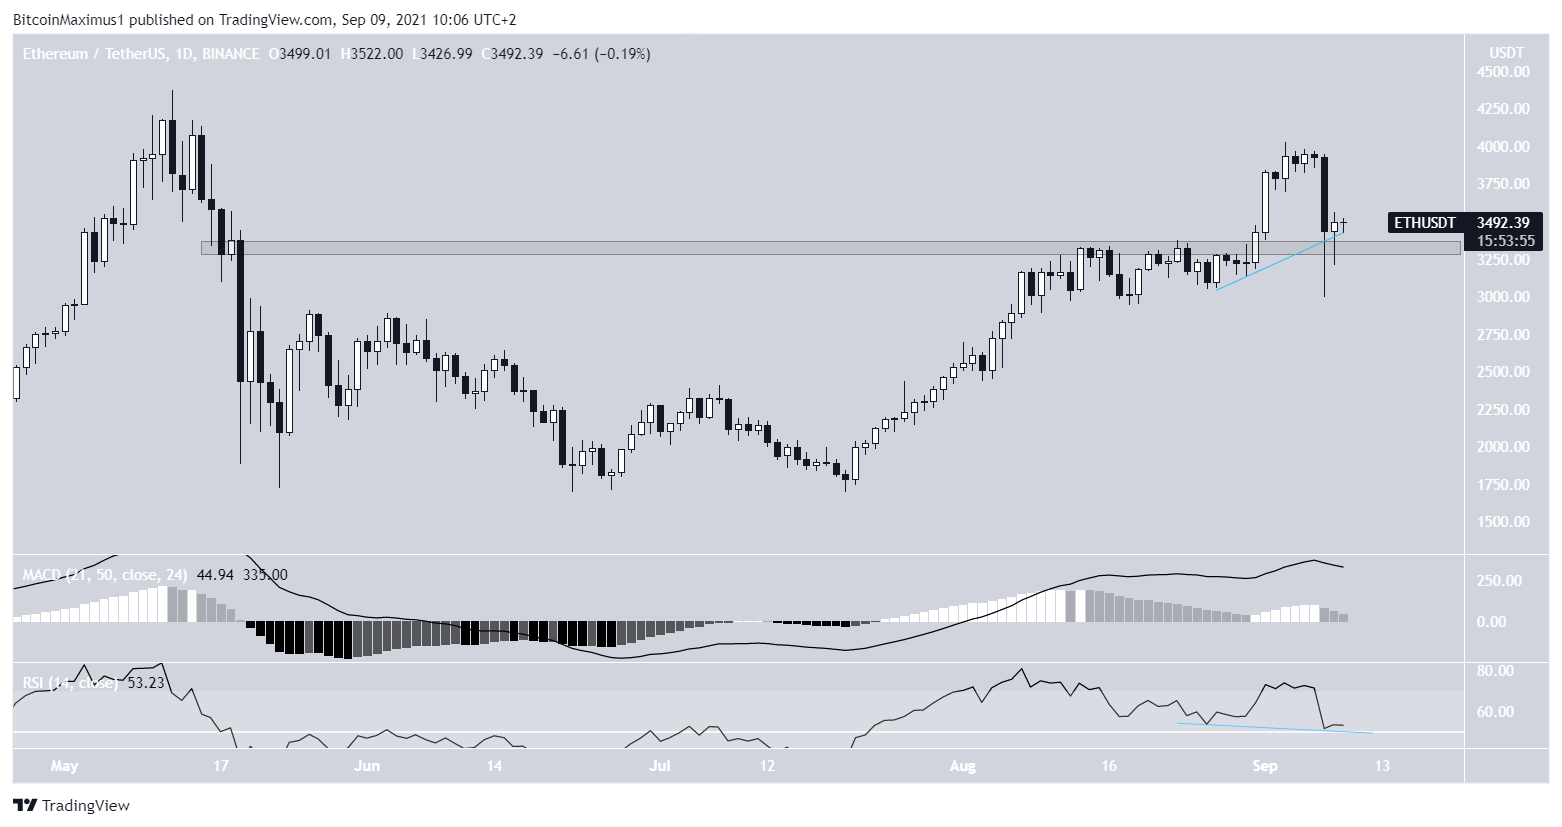
On Aug 31, ETH managed to break out from the $3,330 resistance area and proceeded to reach a high of $4,027 on Sept 3.
However, it fell sharply four days later and reached a low of $3,005. It rebounded after making this low and created a long lower wick.
Technical indicators are mixed. While both the MACD and RSI are decreasing, the former is positive and the latter is above 50. In addition to this, the RSI has generated a hidden bullish divergence.
Long-term indicators are showing bearish signs and the wave count suggests that a top has been reached.
XRP
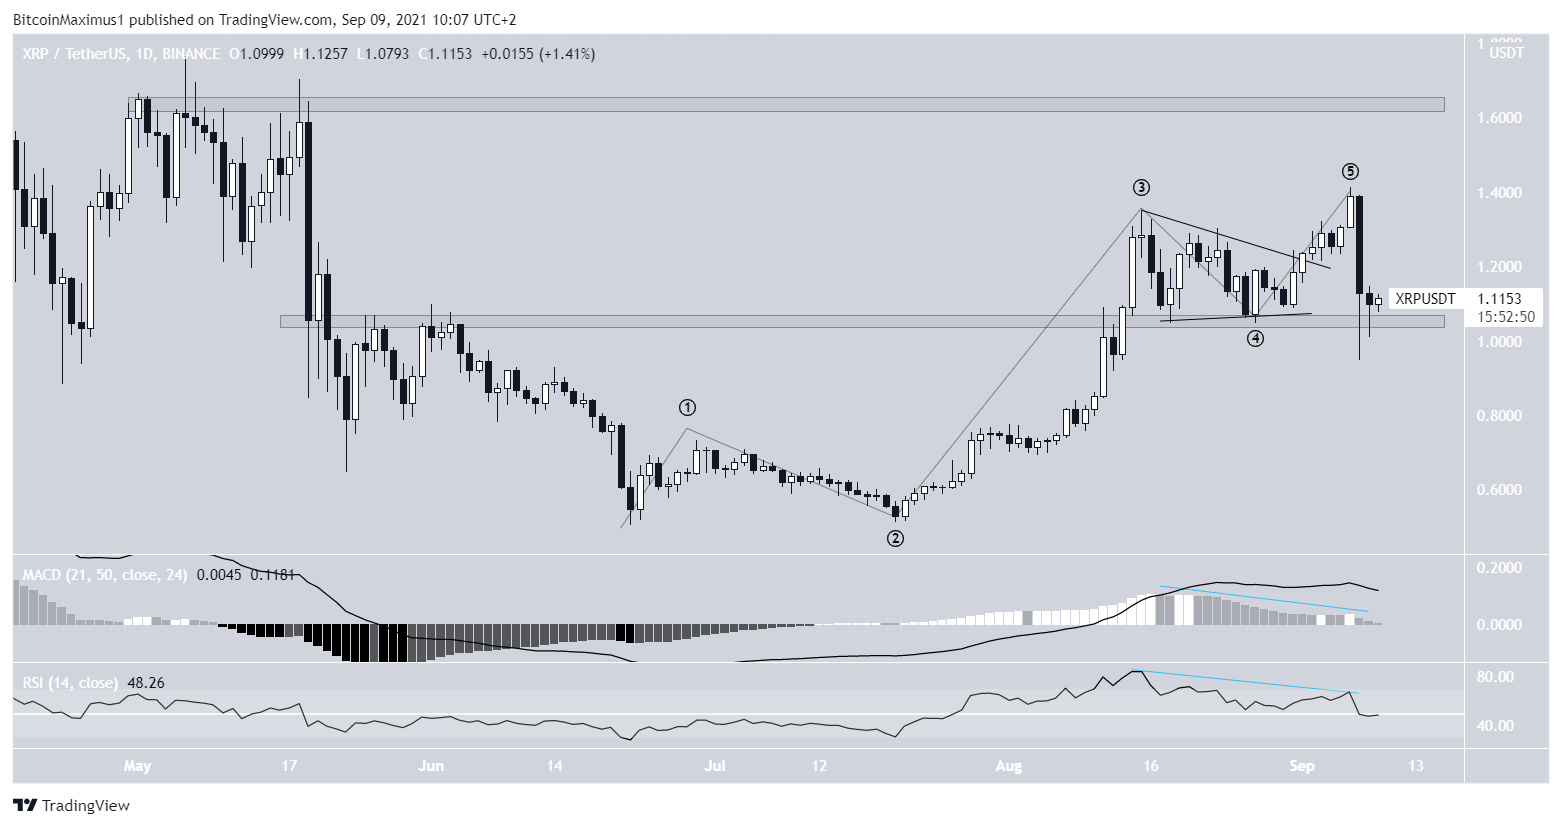
On Aug 13, XRP broke out from the $1.05 horizontal resistance area and validated it as support six days later.
The ascent continued with a breakout from a symmetrical triangle, which led to a high of $1.41 on Sept 6.
However, XRP experienced a sharp drop on Sept. 7, which was preceded by bearish divergences in both the RSI and MACD.
While XRP is still holding above the $1.05 support area, it’s possible that the bullish impulse is complete and XRP is now correcting.
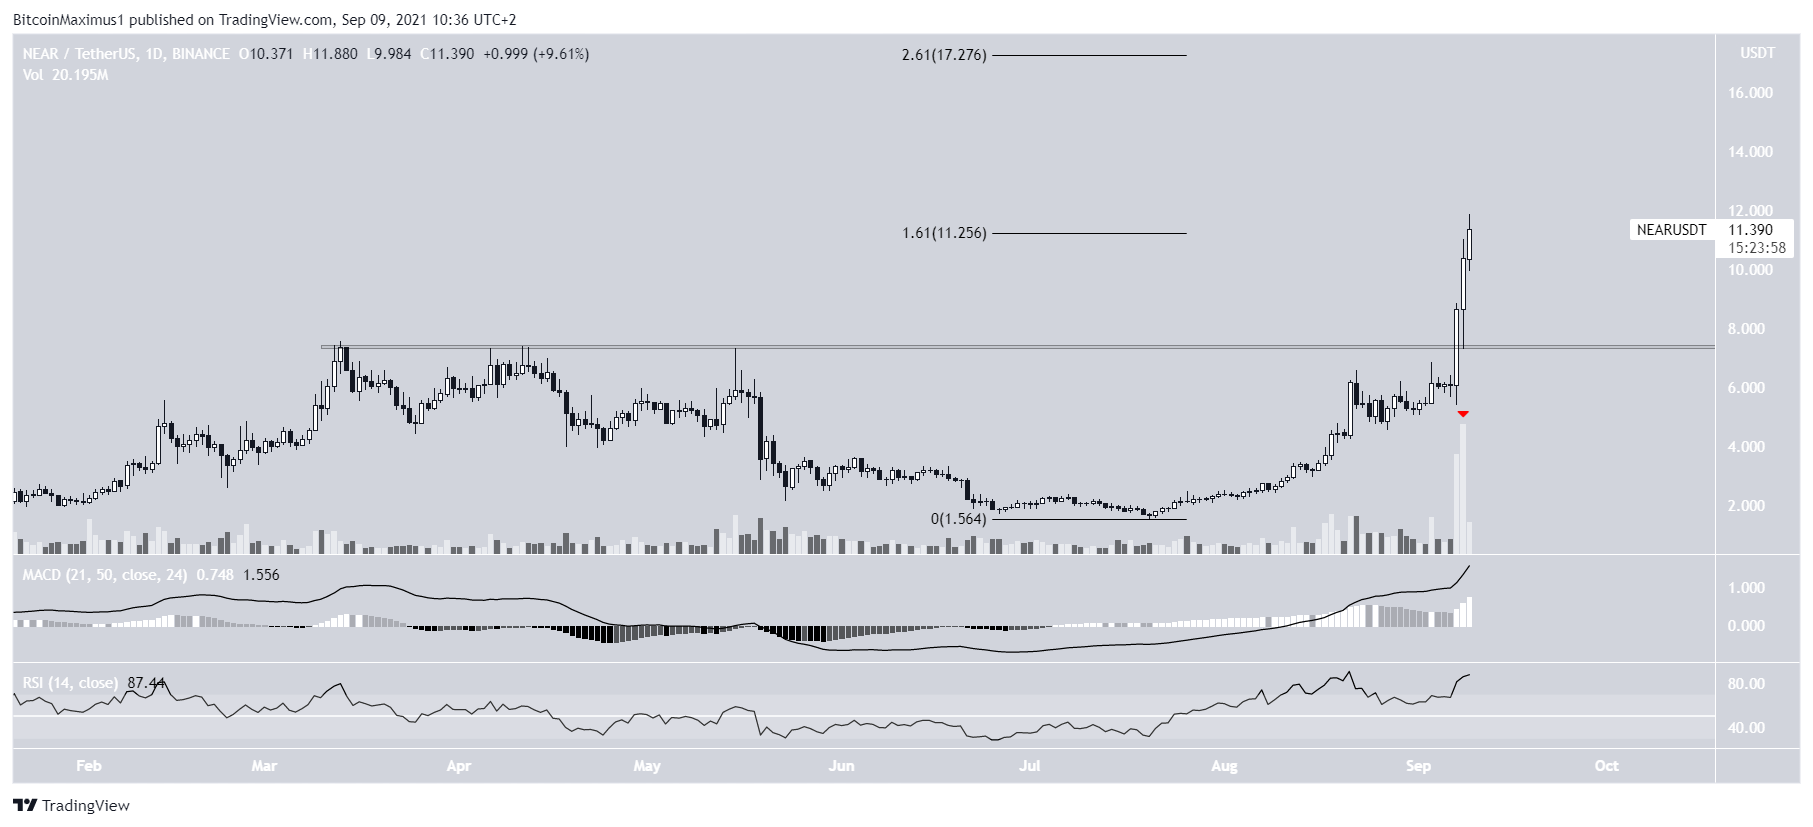
NEAR
On Sept 7, NEAR broke out above the $7.80 horizontal resistance area amid a considerable bullish candlestick. The breakout occurred with very significant volume.
NEAR has been increasing since then and reached a new all-time high price of $11.88 on Sept 9. The high was made just above the 1.61 external Fib retracement level when measuring the most recent drop.
If the upward move continues, the next resistance would be found at $17.27. This target is the 2.61 external Fib retracement level.
Neither the MACD nor RSI is showing any signs of weakness.
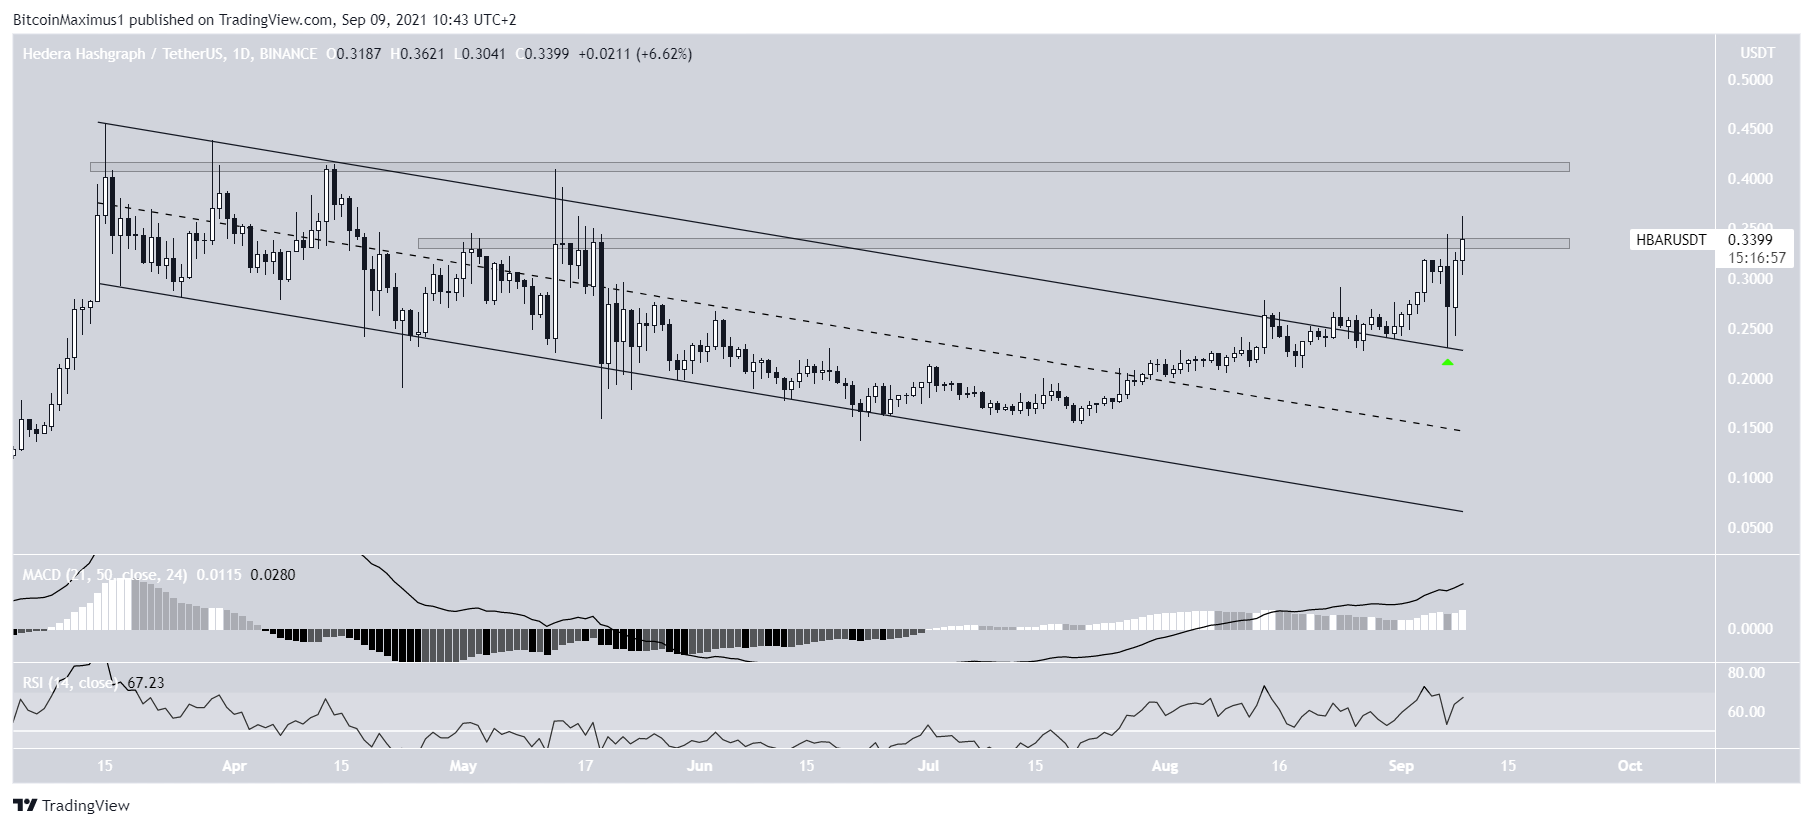
HBAR
HBAR had been decreasing inside a descending parallel channel since March 15. The downward movement continued until a low of $0.1382 was reached on June 22.
HBAR has been moving upwards since, and on Aug 14, it broke out from the parallel channel. It dropped back to validate the resistance line of the channel as support (green icon) on Sept 8.
Currently, HBAR is attempting to break out from the $0.34 horizontal area. If it does, the next resistance level would be at $0.42.
Both the MACD and RSI are increasing, supporting the possibility of a breakout.
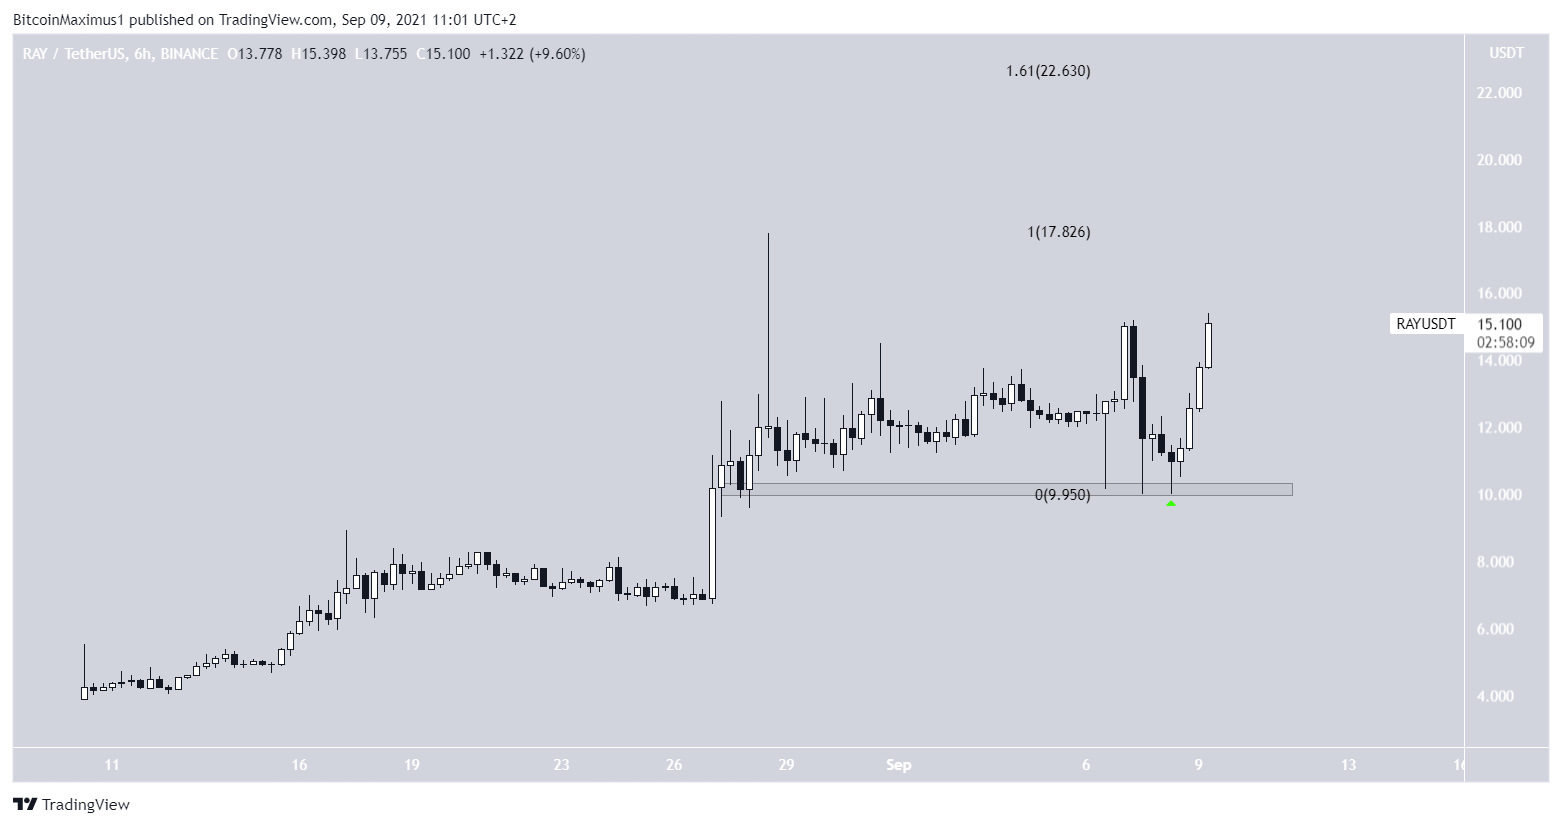
RAY
RAY had been moving upwards in August and on Aug 28, it reached a high of $17.80.
A drop followed to validate the $10 area as support on Sept 8, and RAY has been increasing since.
If it’s successful in breaking out above the current resistance, the next resistance area would be found at $22.60. This is the 1.61 external Fib retracement resistance level.
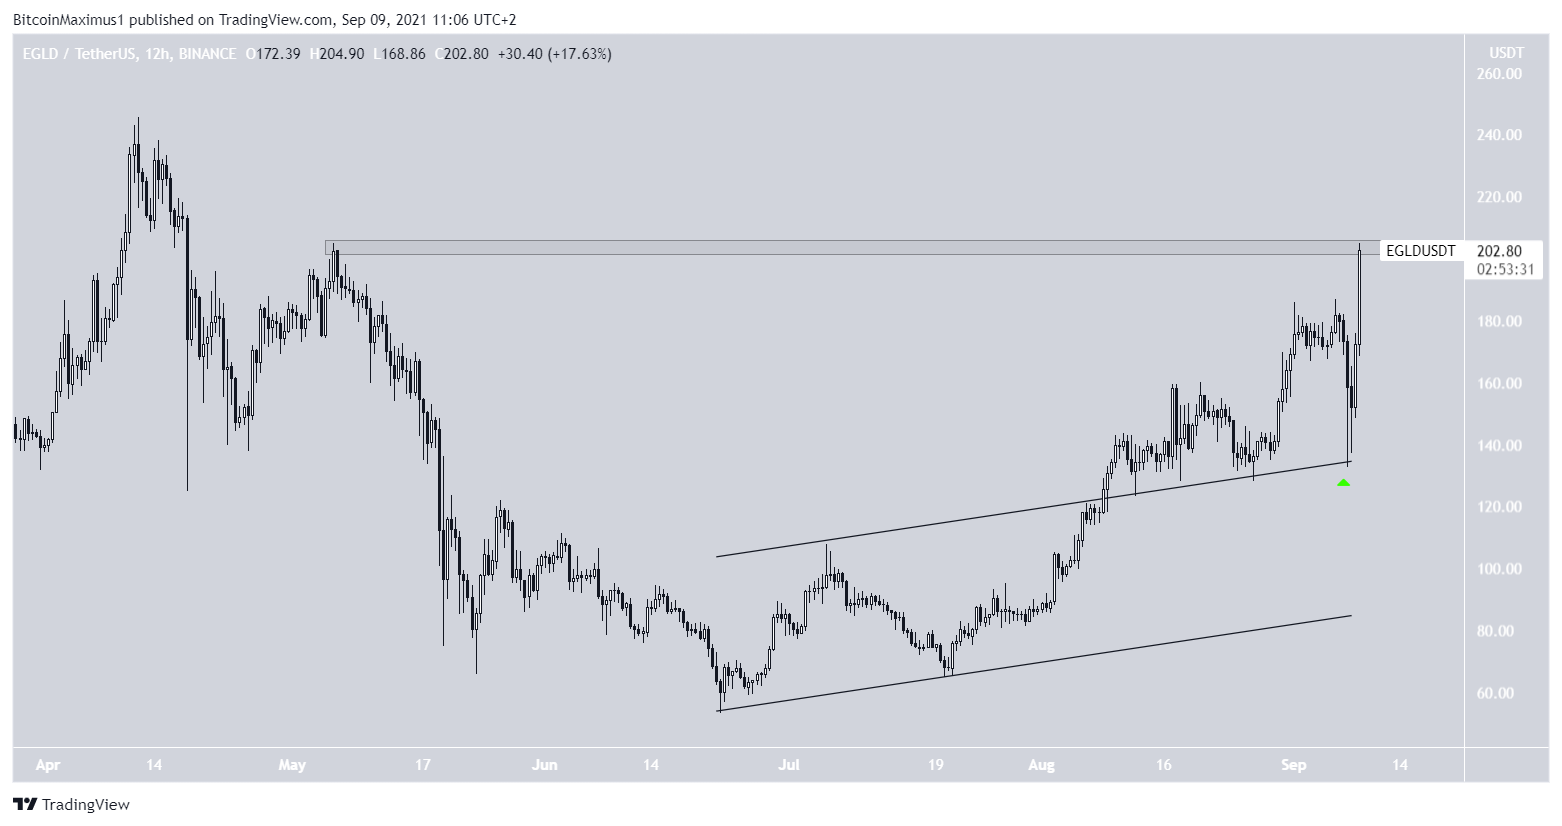
EGLD
EGLD had been increasing inside an ascending parallel channel since June 22. On Aug 10, it managed to break out and validate the resistance line of the channel as support (green icon). Following the validation, EGLD experienced a strong rebound.
Currently, EGLD is attempting to move above the $205 horizontal resistance area. Doing so would likely take it towards a new all-time high.