Polkadot is a blockchain-based platform with high scalability and advanced security features. It is a fork-resistant network with data availability and validity capabilities. It facilitates the development of innovative decentralized apps and Non-Fungible Tokens (NFTs) too. Besides, it is a Proof-of-Stake network that allows users to add para-chains by bonding tokens. DOT is the prime governance token of this ecosystem. Let us look at the technical analysis of DOT.
Past Performance
On Jul 16, 2021, DOT opened at $13.07. On Jul 22, 2021, DOT closed at $13.16. Thus, in the past week, the DOT price has increased by roughly 1%. In the last 24 hours, DOT has traded between $11.91-$13.49.

https://s3.tradingview.com/snapshots/4/41z3YY7t.png
Day-Ahead and Tomorrow
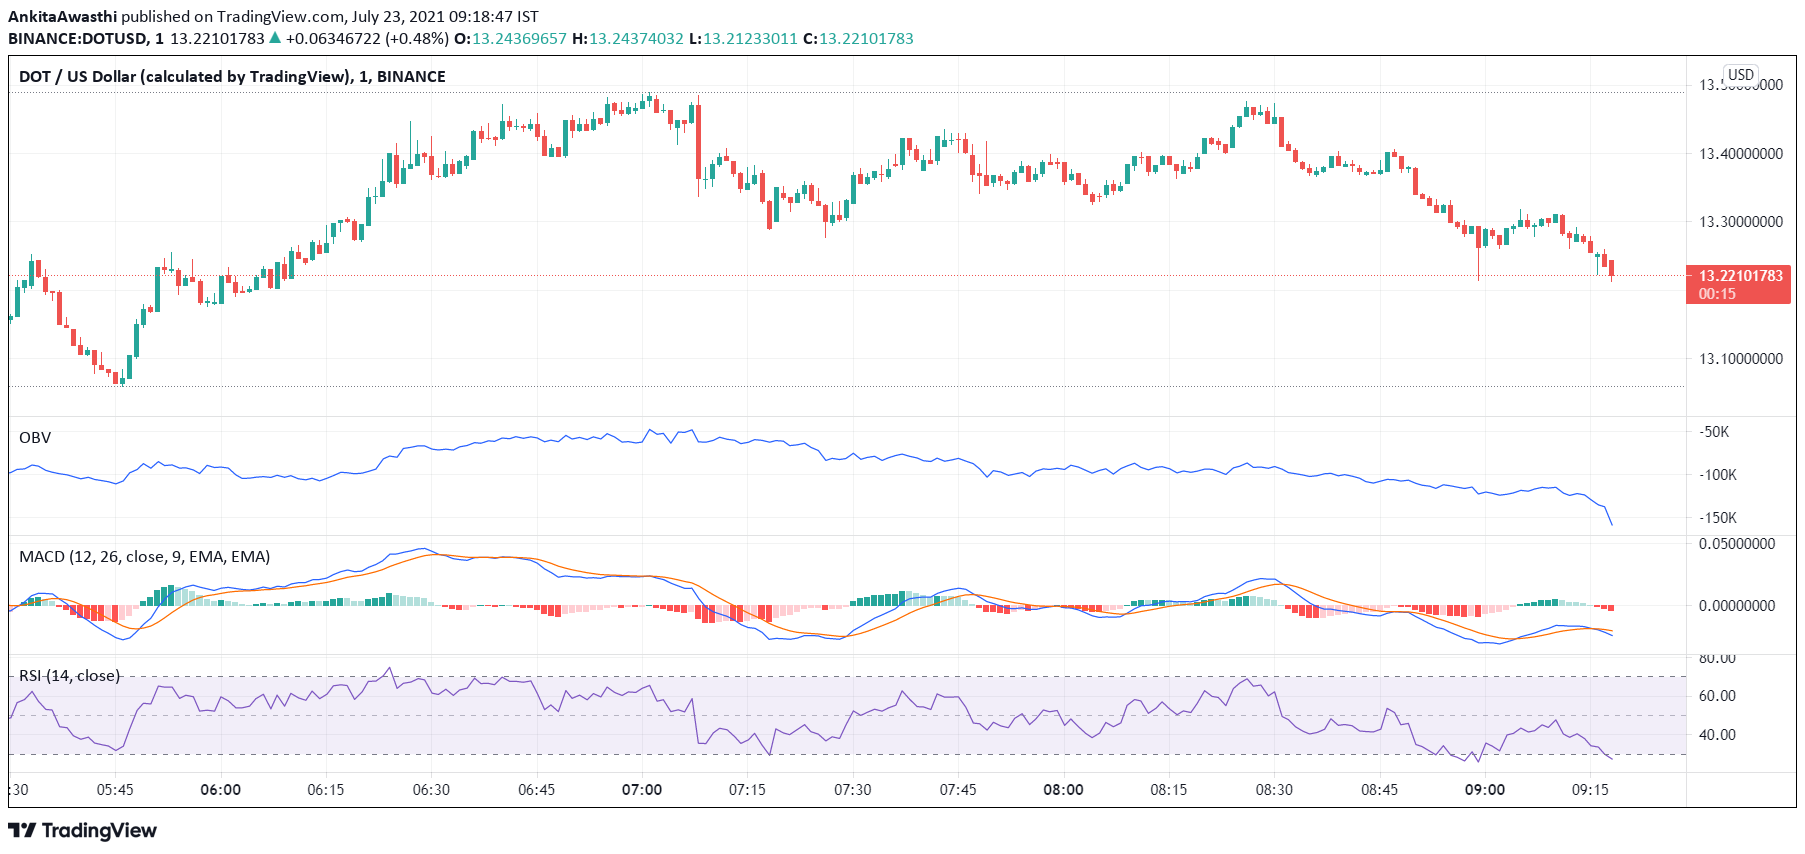
Currently, DOT is trading at $13.22. The price has increased from the day’s opening price of $13.16. Thus, the market seems bullish.
The MACD and signal lines are negative. Moreover, a bearish crossover by the MACD line over the signal line has occurred. Thus, the overall market momentum is bearish. Hence, we can expect the price to start falling soon.
Currently, the RSI indicator is at 24% — deep into the oversold region. It faced rejection at 48% and fell to the current level. Hence, selling pressures are extremely high. High selling activity will exert downward pressure on the DOT price.
The OBV indicator is also downward sloping. Thus, selling volumes are higher than buying volumes. Heavy selling volumes will push the price downwards. In short, all three indicators have given bearish signals.
DOT Technical Analysis
Currently, the price is below the first Fibonacci pivot resistance level of $13.46. The price may soon fall below the Fibonacci pivot point of $12.85. By day end, it may fall below the first, second, and third support levels of $12.25, $11.88, and $11.27, respectively.
The price may soon test and fall below the 76.4% FIB retracement level of $13.12. By day close, if the price tests and falls below the 23.6% FIB retracement level of $12.28, the price downtrend is probably strong enough to sustain till tomorrow.
 cryptoknowmics.com