XinFin Network is an enterprise-level hybrid blockchain network that aims to promote global trade and finance. It is driven by smart contracts and has characteristics of both public and private blockchains. It is a decentralized, interoperable, and Proof-of-Stake based ecosystem. XDC is the customized token of this network. Let us look at the technical analysis of XDC.
Past Performance
On Jul 15, 2021, XDC opened at $0.089. On Jul 21, 2021, XDC closed at $0.072. Thus, in the past week, the XDC price has decreased by roughly 19%. In the last 24 hours, XDC has traded between $0.069-$0.075.
https://s3.tradingview.com/snapshots/m/mcVCdN7Q.png
Day-Ahead and Tomorrow
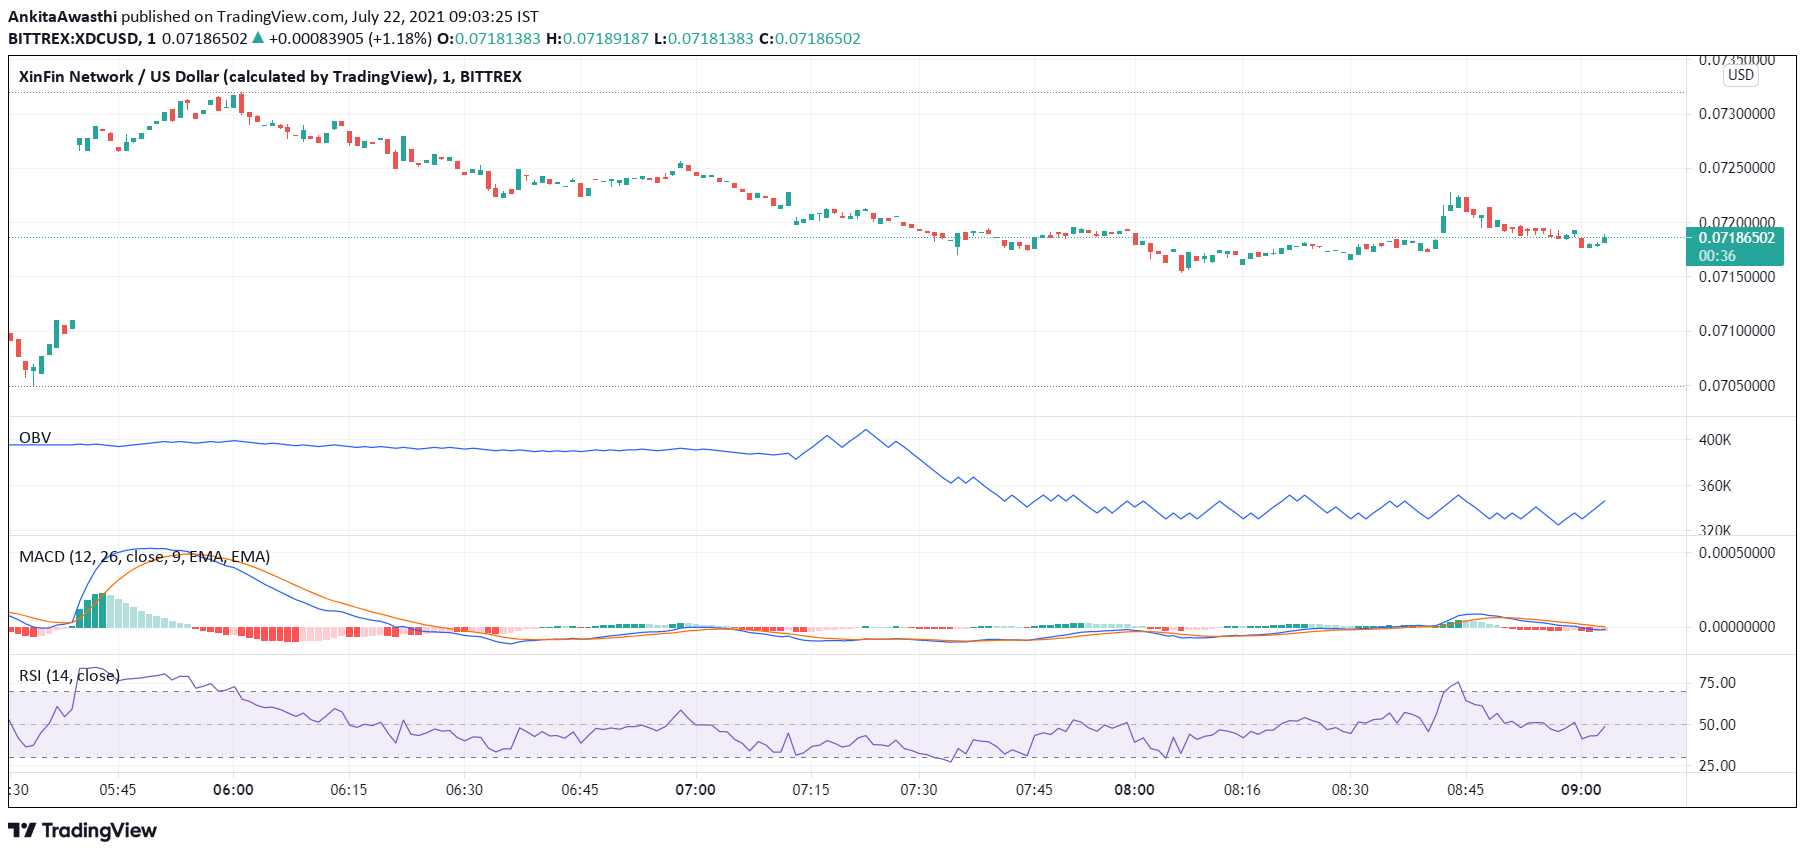
Currently, XDC is trading at $0.072. The price hasn’t changed from the day’s opening price of $0.72. Thus, the market seems neutral with equal buying and selling pressures.
The MACD and signal lines are turning negative. Moreover, a bearish crossover by the MACD line over the signal line has occurred. Thus, the overall market momentum is bearish. Hence, we can expect the price to start going down.
Currently, the RSI indicator is at 45%. It faced rejection at 41% and rose to the current level. However, selling pressures are still high. High selling activity will exert downward pressure on the XDC price.
However, the OBV indicator has gradually started rising. Thus, buying volumes may slowly overtake selling volumes. Hence, the price may start rising soon.
In short, when we look at all three oscillators together, we can say that the overall market momentum is negative as of now. However, the possibility of a trend reversal cannot be ruled out.
XDC Technical Analysis
Currently, the price is below the Fibonacci pivot point of $0.072. The price may soon break out of it and rise above the first resistance level of $0.074. Thereafter, we have to wait and watch if the price continues to rise or starts falling again.
Currently, the price is above the 38.2% FIB retracement level of $0.071. It may soon break out of the 50% FIB retracement level of $0.072. If the price retests and falls below these levels by day close, the price downtrend is probably strong enough to sustain till tomorrow.