- The coin is trading at $170.55 around 14.78% with respect to previous level
- The coin is showing reversal form the support with bullish engulfing pattern
- The coin is trading at 0.00539 BTC around 7.57% up and 0.08905 ETH around 5.40% up with respect to bitcoin and ethereum
The function of the coin is to provide a massively interoperable and scalable framework for developers. The market capitalization of the coin is around $1,645,697,694 and the circulating supply of 8,470,098.06 KSM. The volume of the coin is decreasing from the last few days but today’s volume indicates that this rise in price is a short term correction. Last 24hrs volume of the coin is $122,200,537 which 7.33% down from tomorrow volume
CHARTS ANALYSIS
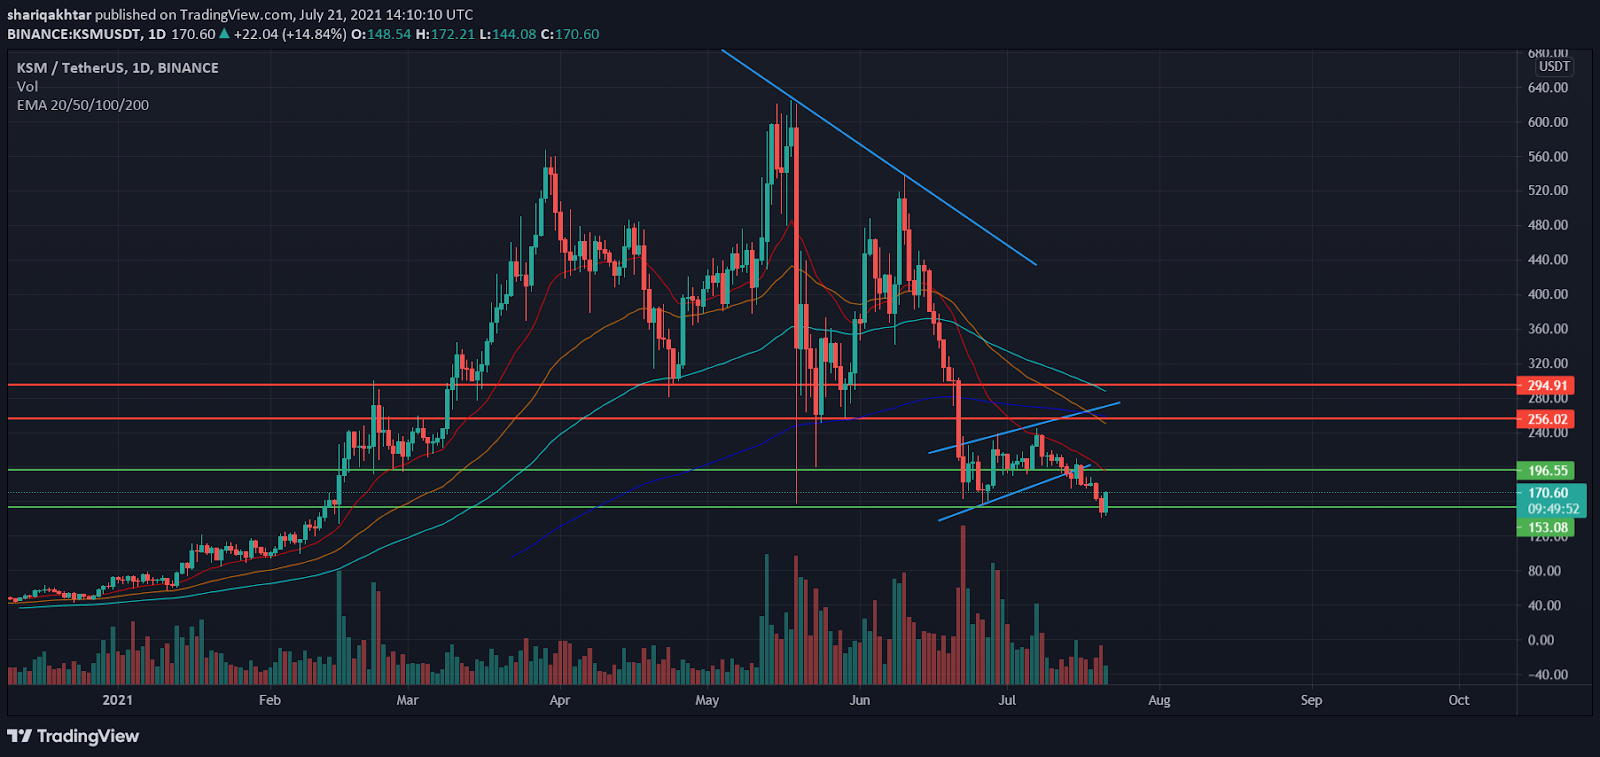
We can see on charts that the coin is trading at $171 around 14-15 %. This rise in coin is because the coin takes the correction from the support and makes a bullish engulfing candle. The coin had given the breakout from the channel pattern and falls toward the support and today it forming reversal candle on the support shows the coin is on its major support
INDICATOR ANALYSIS
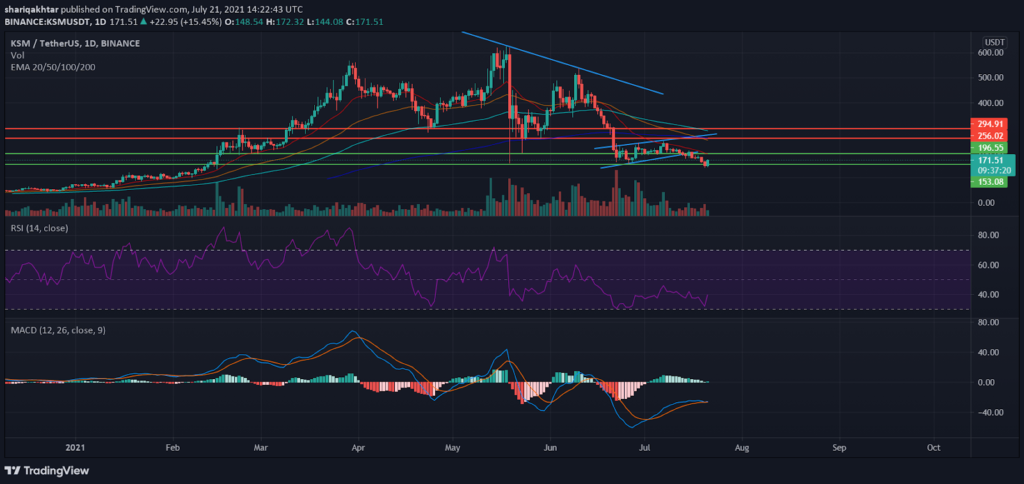
According to the indicator analysis we find out that the coin is trading below its all major exponential moving average. On charts we can say that the coin had formed a death cross on the charts which means that 200 DEMA had crossed the 50 DEMA it indicates the fall in the coin .
RSI is trading at 40.40 and shows reversal from the oversold zone. there is no sign of any divergence in the coin
In MACD we can see that signal and MACD line are trading flat and increasing histogram form the previous level shows the coin show some correction in downtrend
MAJOR SUPPORT AND RESISTANCE ZONE FOR THE COIN IS
S1= $153.08 S2= $ 118.45
R1= $196 R2= $256