Binance Coin (BNB) has bounced at a long-term Fib support level at $268 and is trading inside a symmetrical triangle.
The direction of the next movement is undetermined, and will likely be decided based on whether or not BNB breaks down below the support line of the triangle.
Long-term Binance Coin movement
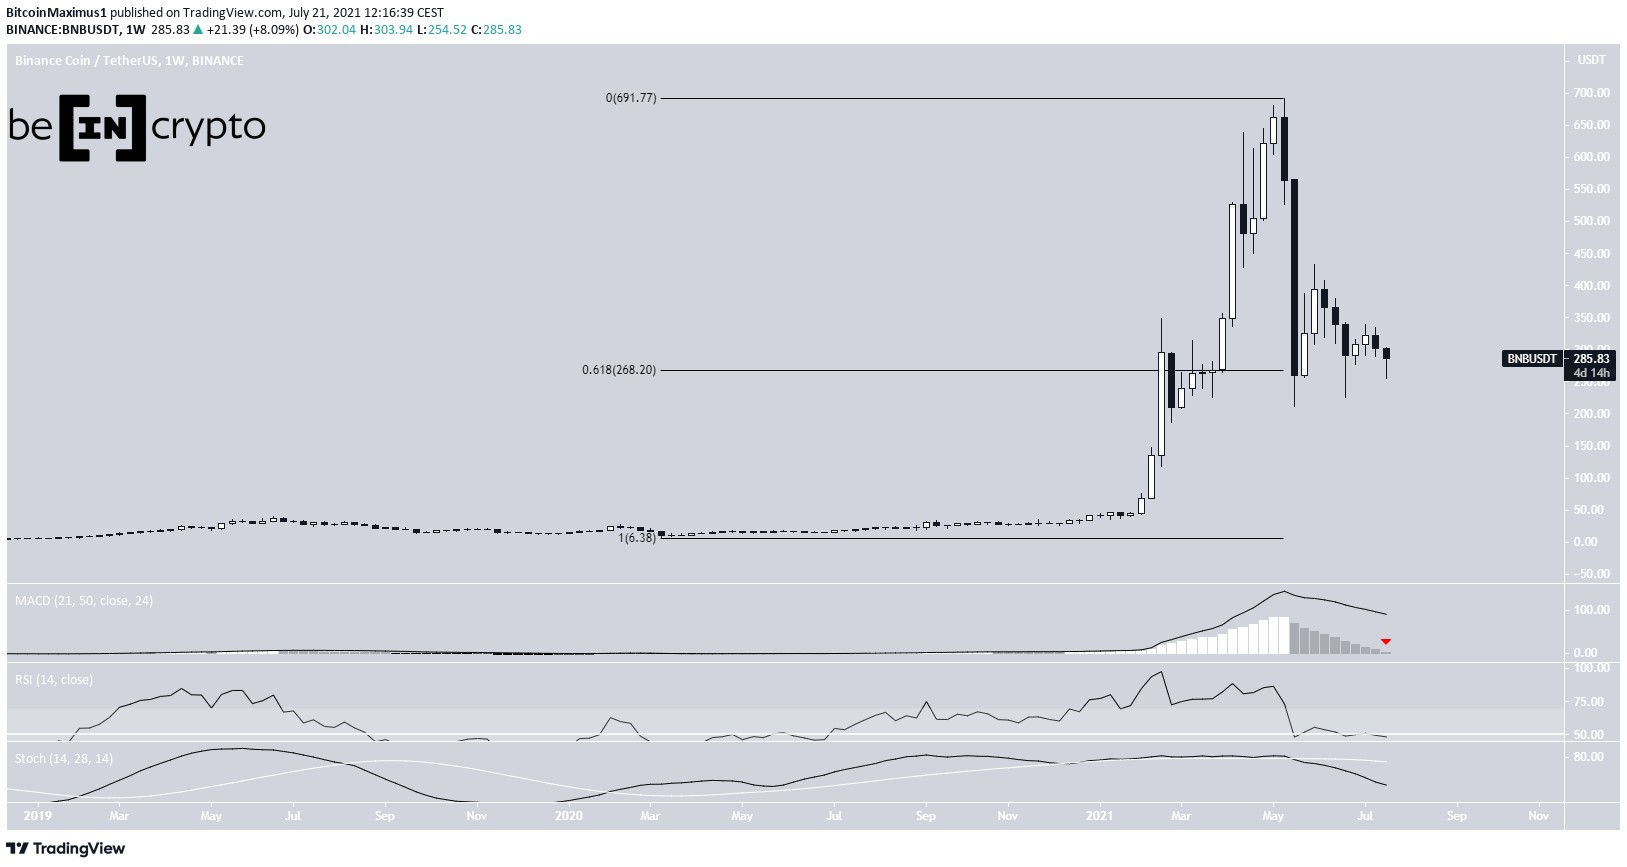
BNB has been moving downwards since reaching an all-time high of $691.77 on May 10. The downward move continued until a low of $211.70 was reached on May 23.
The bounce that followed left a lower wick in place and validated the $268 area as support. This is the 0.618 Fib retracement support level when measuring the entire upward movement beginning in March 2020.
Currently, BNB is trading at $285, just above this support level.
Despite the bounce, technical indicators are bearish. The MACD is almost negative, the RSI is below 50, and the Stochastic oscillator has made a bearish cross.
Neutral BNB pattern
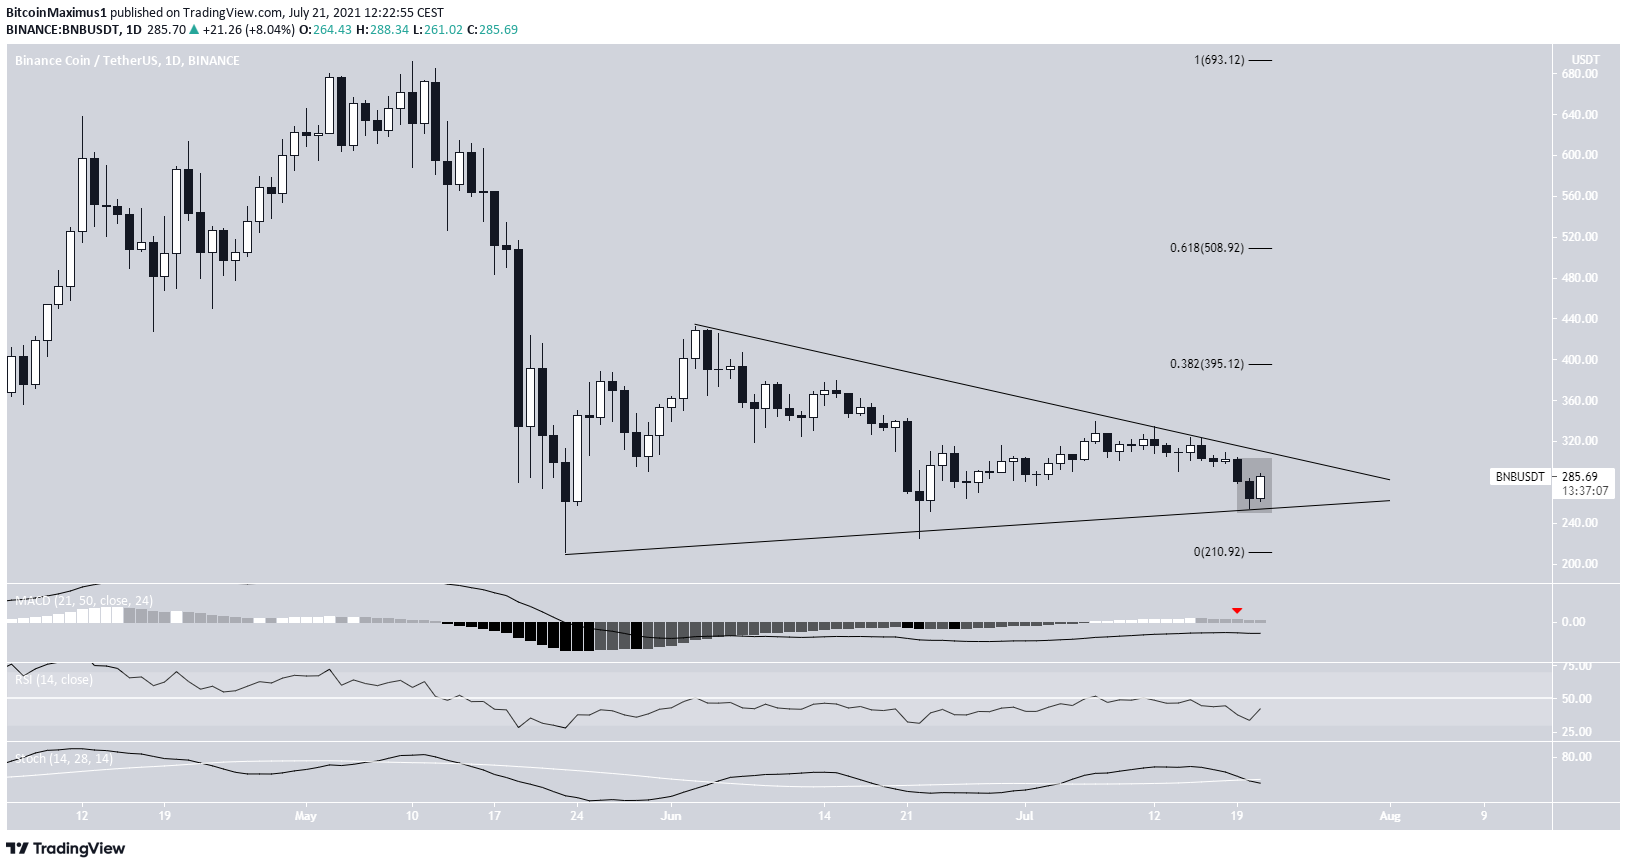
The daily chart shows that BNB has been trading inside a symmetrical triangle since it first bounced on May 19. More recently, it bounced at the support line of the pattern on July 21.
The daily close is extremely important, since it could create a bullish engulfing candlestick if it manages to sustain the current level until the daily close.
However, while the symmetrical triangle is often considered a neutral pattern, it’s transpiring after a downward move. Therefore, a breakdown would be more likely.
In addition to this, technical indicators are bearish. The MACD has given a bearish reversal signal, the Stochastic oscillator has made a bearish cross, and the RSI is below 50.
If a breakdown occurs, BNB would likely revisit the $200 levels once again. Conversely, the closest resistances are at $395 and $508. These are the 0.382 and 0.618 Fib retracement resistance levels.
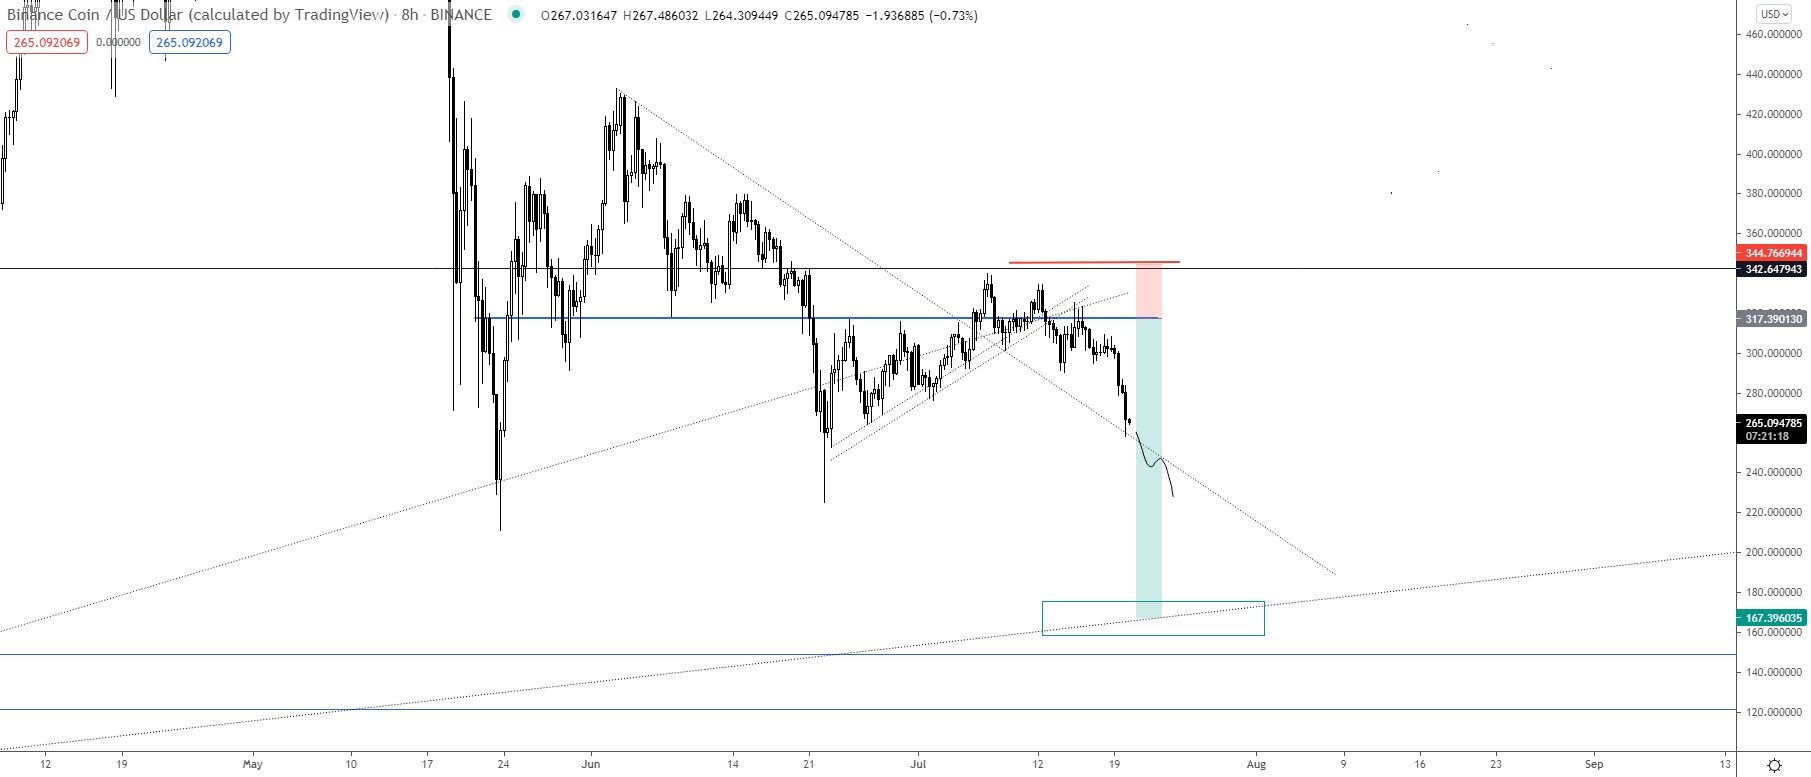
Cryptocurrency trader @TheEuroSniper outlined a BNB chart, stating that the price could fall all the way to the $170 region. In order for this to occur, a breakdown from the current symmetrical triangle is necessary.
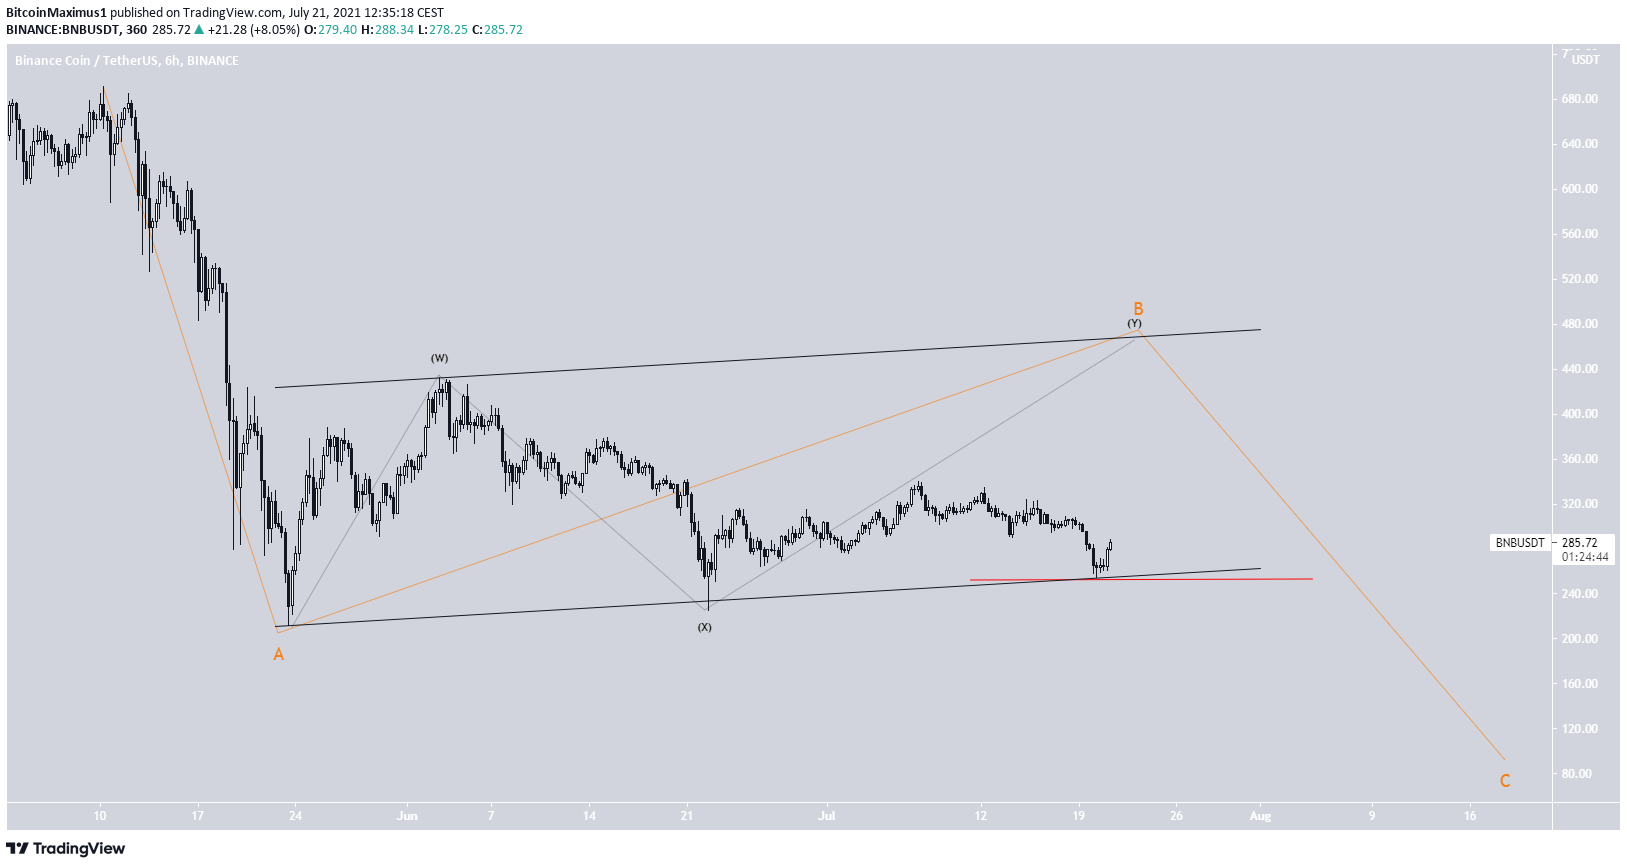
Wave count
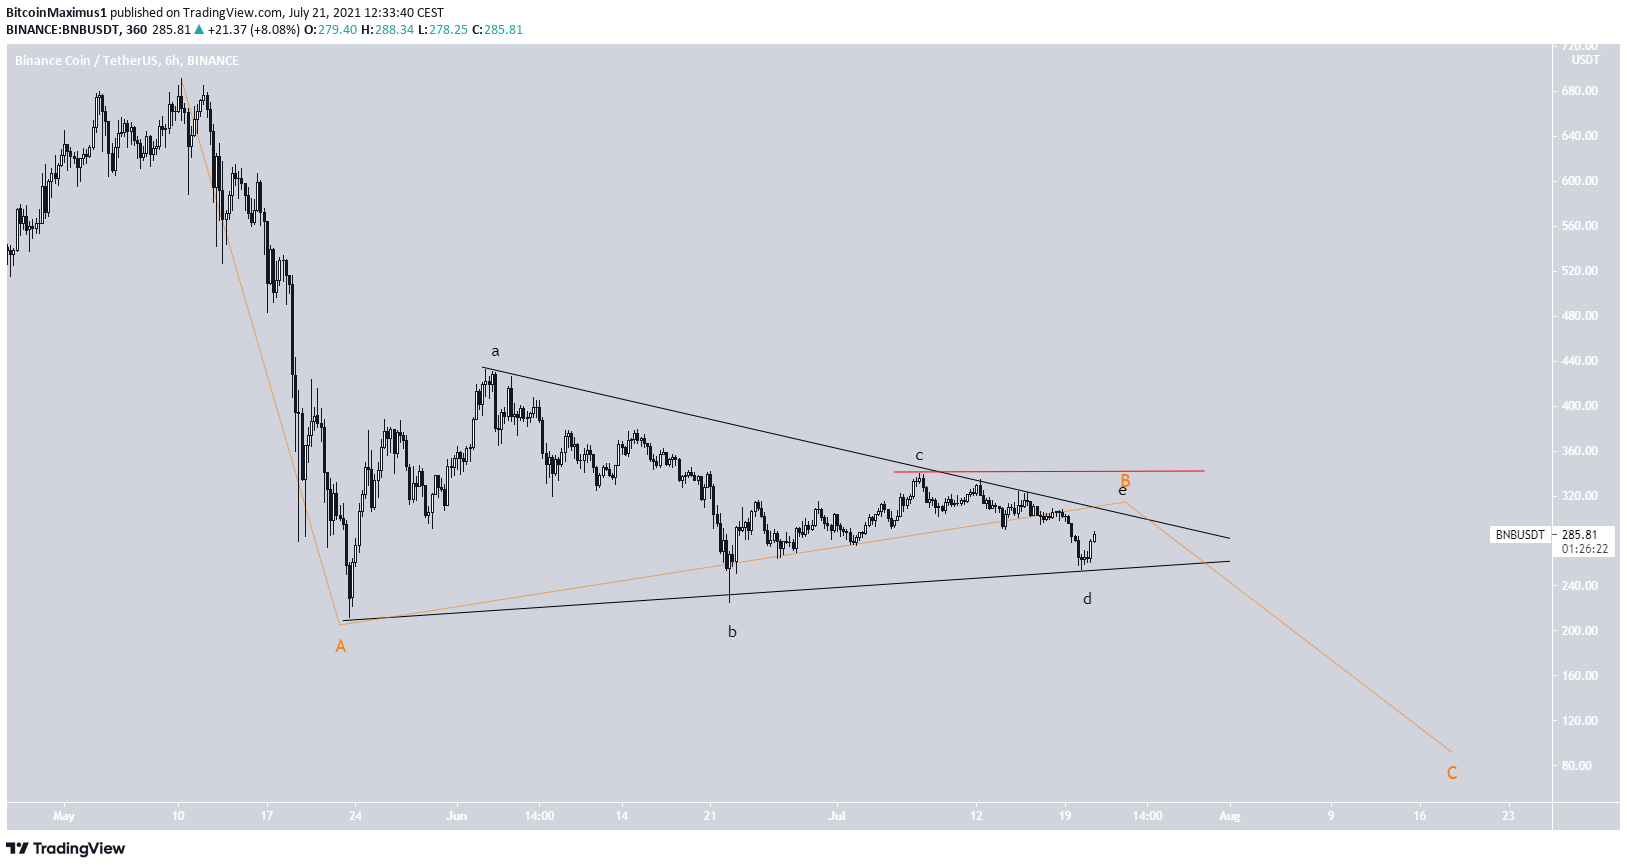
The wave count indicates that BNB is in wave B of an A-B-C corrective structure.
However, the exact shape of the B wave is not yet clear.
The first scenario indicates that the B wave has taken the shape of a symmetrical triangle, as outlined in the previous section.
If correct, BNB could revisit the resistance line of the triangle before breaking down.
An increase above the most recent swing high at $340 (red line) would invalidate this particular wave count.
The second scenario suggests that the B wave is contained inside an ascending parallel channel. In this case, BNB could increase towards the resistance line of the channel near $390 before breaking down.
The count would be invalidated by a decrease below the July 20 low of $254 (red line).
So, whether BNB drops below $254 or increases above $340 will likely determine the direction of the trend.
For BeInCrypto’s latest bitcoin (BTC) analysis, click here.