
Solana is up 8.7% over the past 7 days, supported by a series of bullish catalysts, before the rally came to a halt.
According to market data, $SOL rose from around $65 earlier in the week to nearly $75 before giving back part of those gains, with the token trading near $71 on Thursday as macroeconomic pressures weighed on risk assets.
Institutionelle Adoption treibt Solana-Rallye an
Der Hauptkatalysator der Rallye war die Einführung tokenisierter SpaceX-Aktien auf Solana.
Backpack Securities and Sunrise DeFi introduced SPCX on the network alongside SpaceX's Nasdaq debut, offering 1:1-backed and redeemable on-chain shares that can be traded around the clock.
Das Produkt gab Investoren Zugang zu einem der weltweit wertvollsten privat gehaltenen Unternehmen, während es Solanas Fähigkeit demonstrierte, tokenisierte traditionelle Vermögenswerte zu unterstützen.
Interest in the network grew further after Japanese cryptocurrency exchange bitFlyer announced the listing of Solana.
Die Aufnahme eröffnete japanischen Investoren regulierten Zugang zu dem Asset und brachte eine der größten Börsen des Landes in das wachsende Solana-Ökosystem.
Institutional adoption also extended into fixed-income markets.
Moody's Ratings expanded its Token Integration Engine to Solana through Alpha Ledger, enabling machine-readable credit ratings to be embedded directly into tokenized debt instruments.
Moody's said the integration allows credit intelligence to become part of the underlying asset structure, reducing operational complexity for institutions working with digital securities.
According to CoinGecko, $SOL rallied from roughly $65 on June 11 to more than $75 by June 16 before momentum began to cool.
Even after the recent pullback, the token remains well above its starting point for the week and is still up around 9% over seven days.
Ist Solanas Preis gefährdet?
Technische Indikatoren deuten darauf hin, dass Solanas Erholung nun eine wichtige Prüfung bevorsteht.
On the daily chart, the recent rebound comes after a prolonged decline that followed a potential double-top formation near the $95 to $100 region.
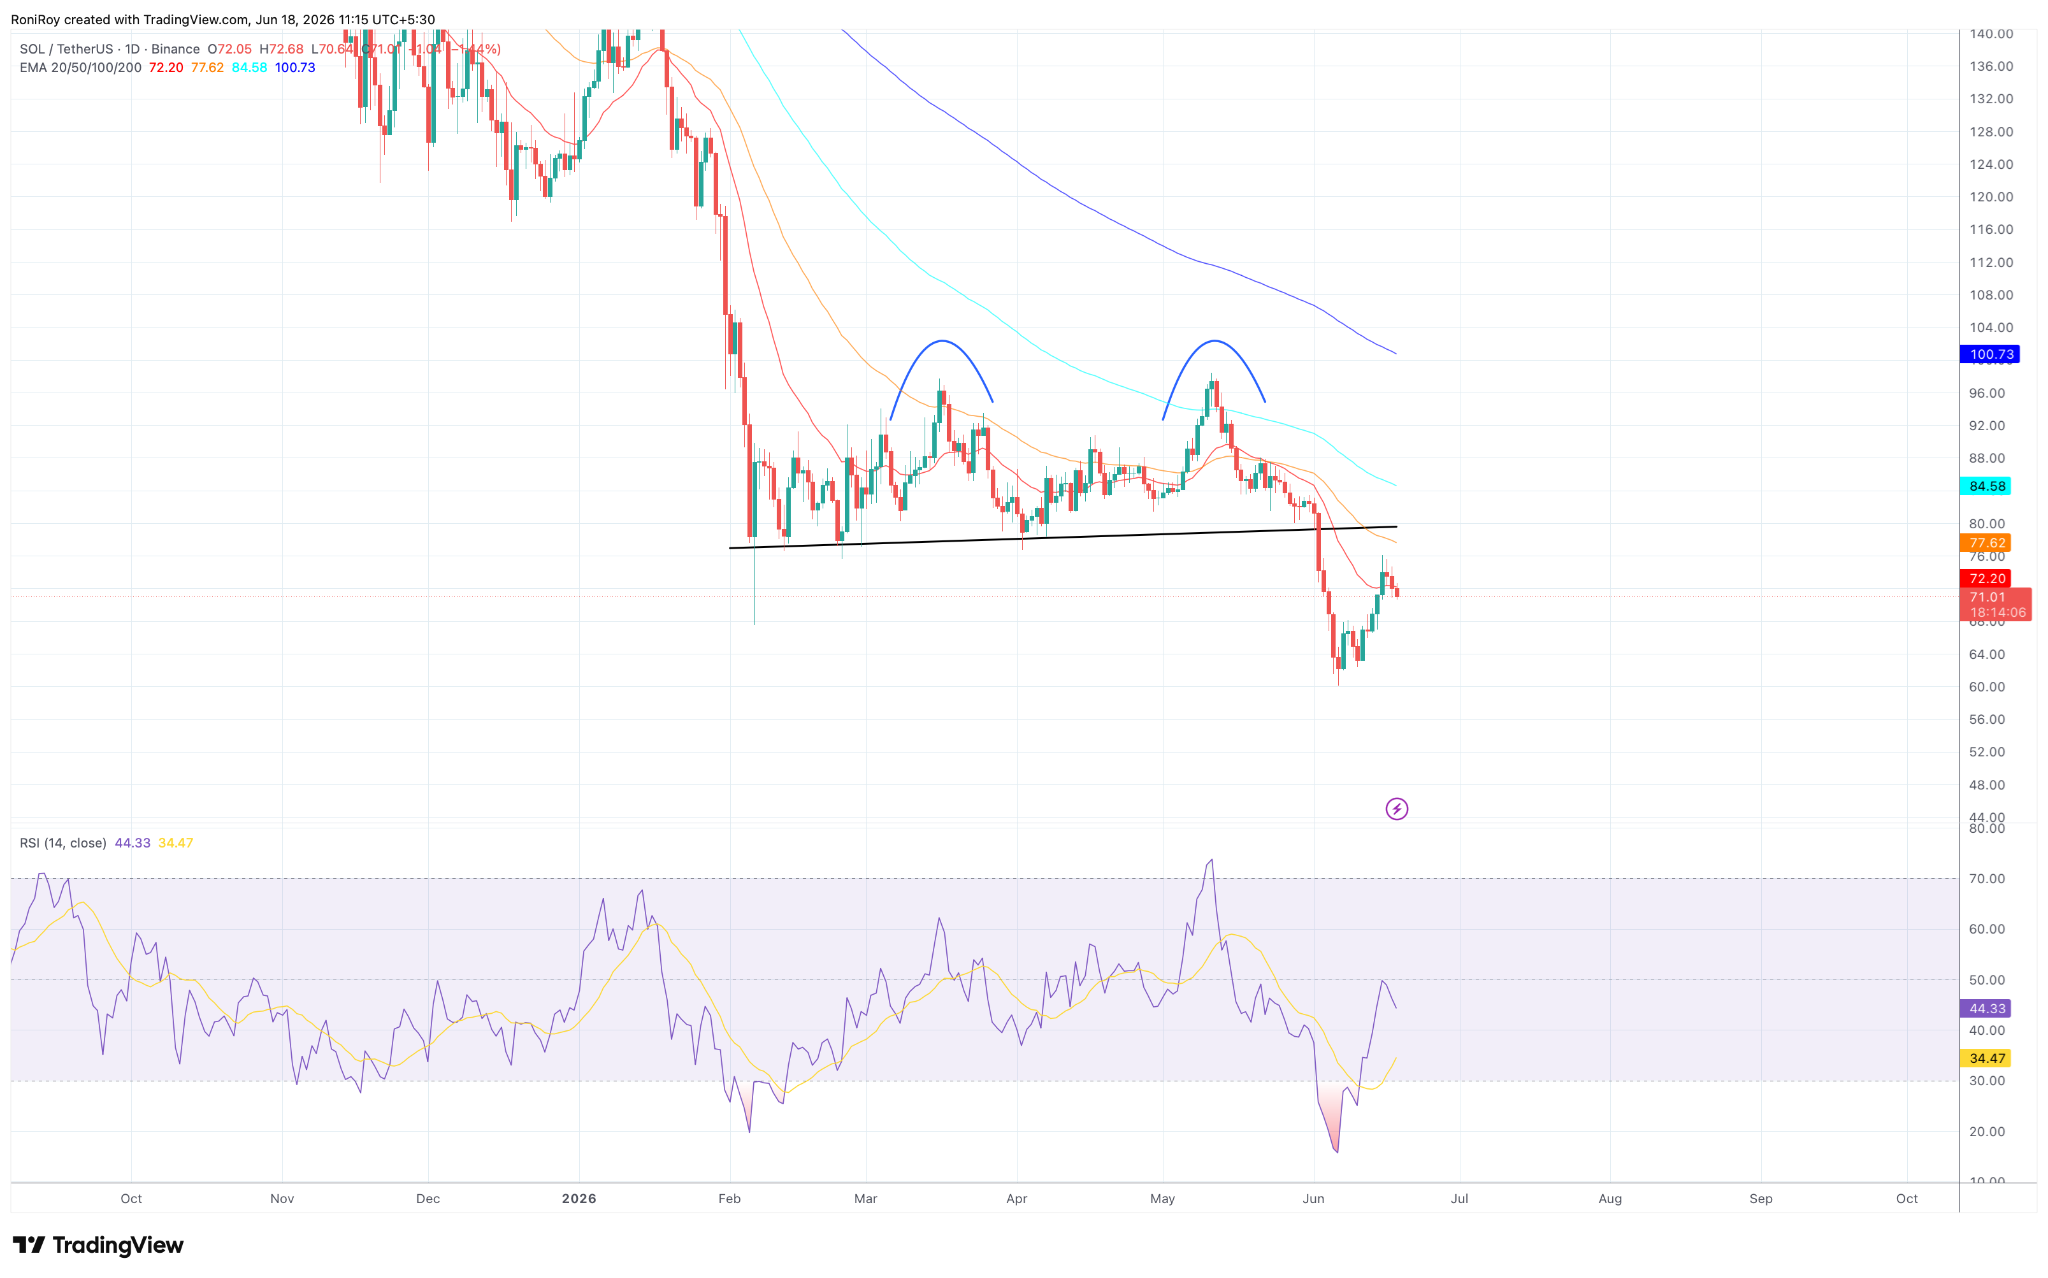
$SOL/$USDT 1-Tages-Preisdiagramm. Quelle: TradingView.
Two failed attempts to sustain gains at those levels were followed by a breakdown below a rising support trendline around $78 to $80, a development that damaged the bullish structure that had been in place since February.
Although buyers stepped in aggressively near the June lows, $SOL still trades below all major daily exponential moving averages.
The 20-day EMA sits near $72.2, while the 50-day, 100-day and 200-day EMAs stand around $77.6, $84.6 and $100.7.
Those levels now form a stacked resistance zone above the current price.
Momentum has improved from the recent selloff, but confirmation of a trend reversal remains absent.
The daily RSI has recovered from oversold conditions and climbed back to around 44, showing selling pressure has eased.
However, the indicator remains below the neutral 50 level, suggesting bulls have yet to regain full control of the trend.
Meanwhile, the four-hour chart shows the recovery losing momentum after reaching the $75 region.
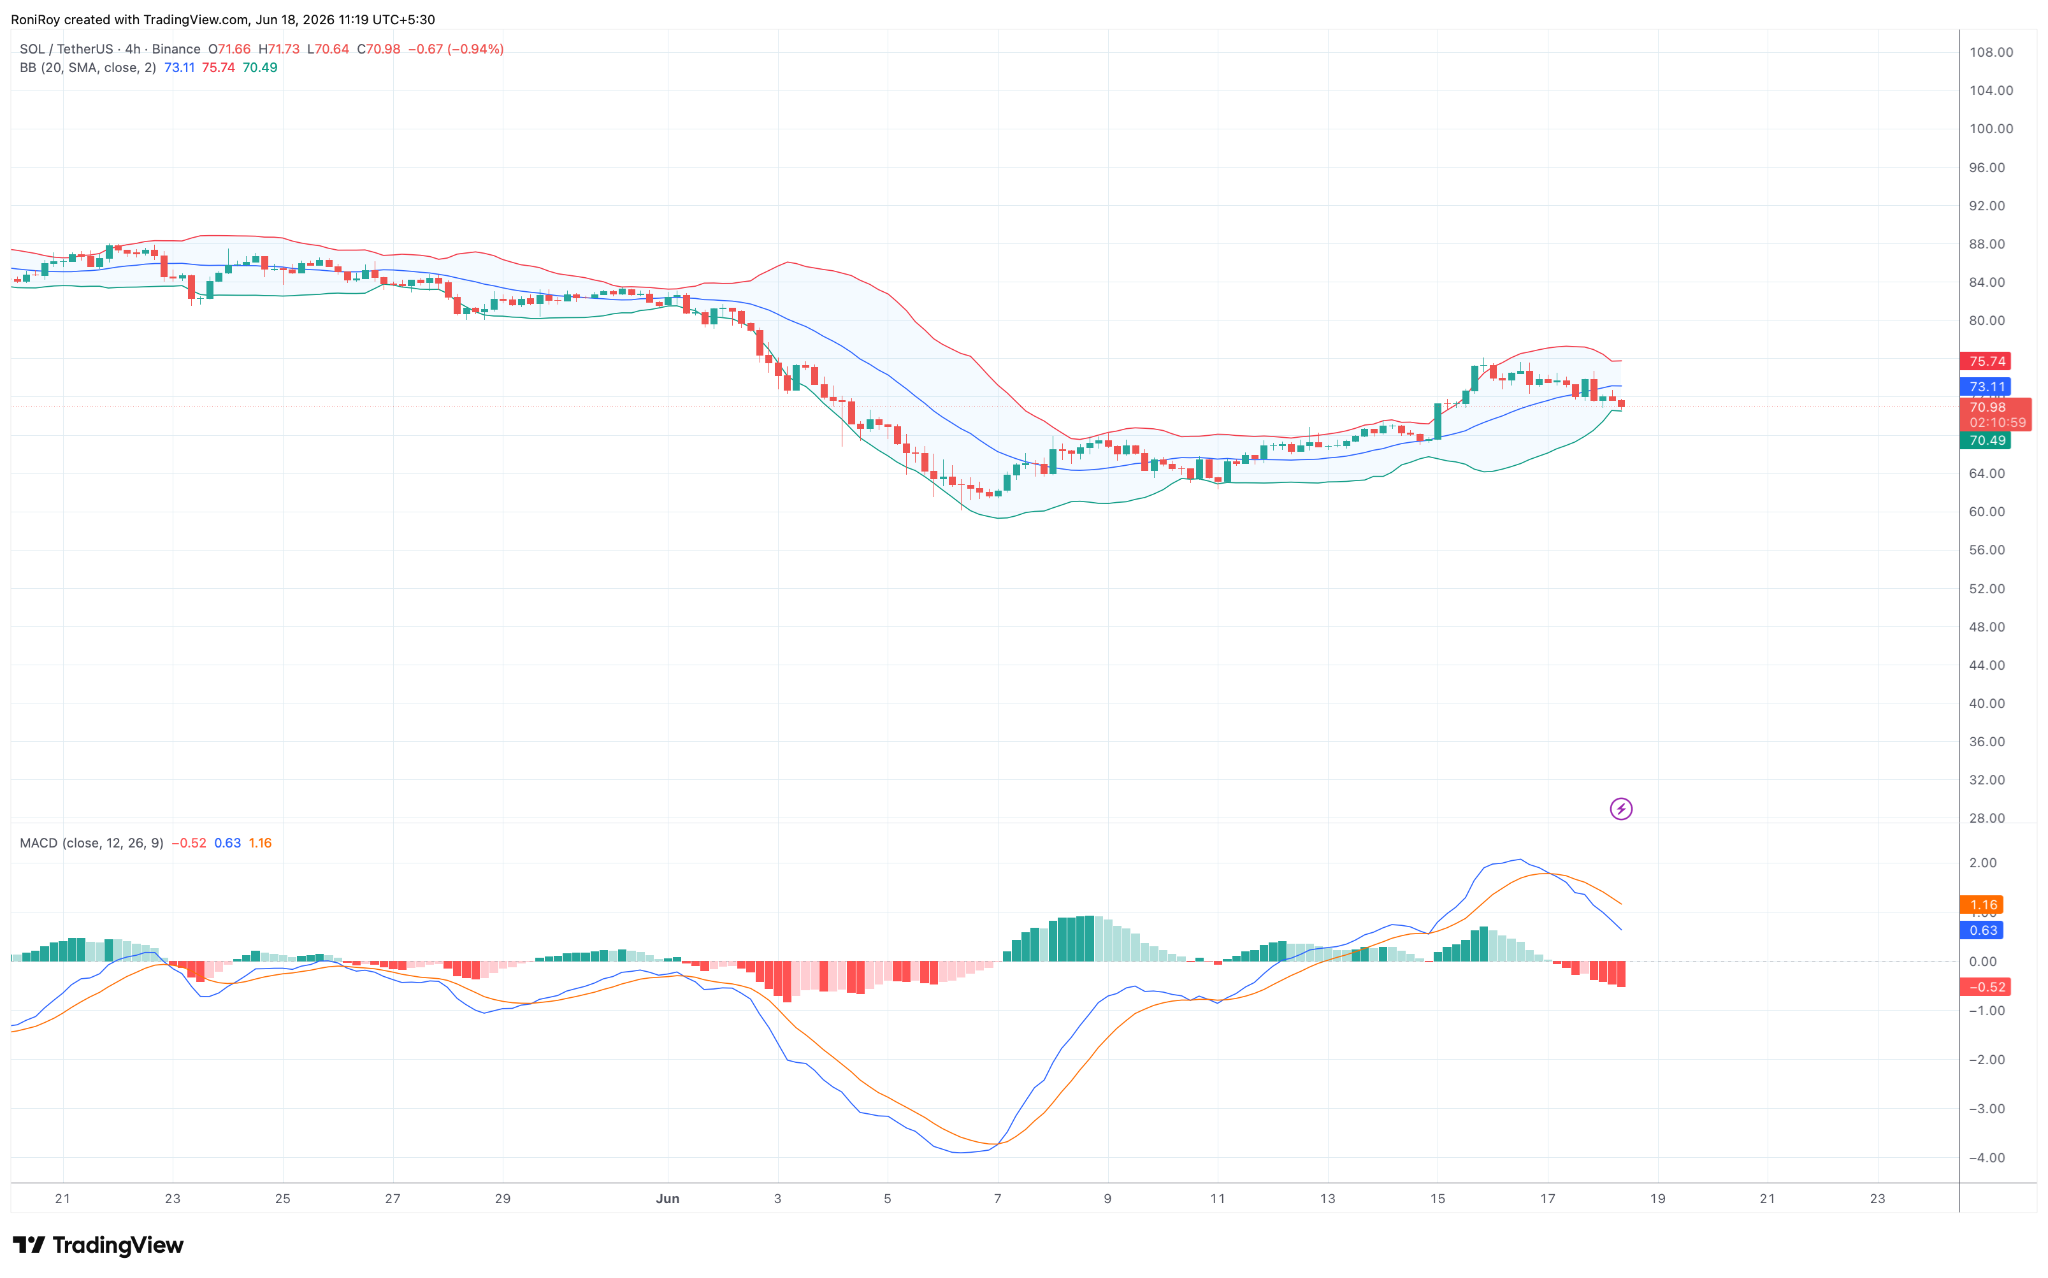
$SOL/$USDT 4-Stunden-Preisdiagramm. Quelle: TradingView.
Following the sharp advance from the $61 low, $SOL pushed into the upper Bollinger Band before encountering resistance.
Price has since drifted lower toward the middle band near $73 and is now hovering close to the lower portion of the range.
The MACD indicator has also turned less constructive. A bearish crossover has formed, with the MACD line falling below the signal line while the histogram has moved into negative territory.
Such a setup often points to weak short-term momentum, particularly after a strong relief rally.
CoinGecko data shows $SOL climbed more than 8% over the past seven days, but much of the advance occurred between June 15 and June 16.
Since reaching local highs near $75, the token has struggled to extend gains and has instead moved into a period of consolidation and pullback.
For now, the $70 to $71 area remains a key support zone.
Holding above that range would keep the recovery intact and leave the door open for another attempt at $75 and potentially the former support area around $80.
A break below it could place the recent rebound under renewed pressure, especially if macroeconomic uncertainty continues to weigh on risk assets.
Based on the charts, it looks like traders are now weighing the recent bullish catalysts against a more challenging macro backdrop, making the battle around current support levels particularly important in the days ahead.