- El precio en efectivo de Bitcoin comenzó una nueva caída desde la zona de $ 135 frente al dólar estadounidense.
- El precio ahora se cotiza por encima de la zona de $ 125 y el promedio móvil simple de 55 (4 horas).
- Se está formando una línea de tendencia alcista clave con soporte cercano a $ 128 en el gráfico de 4 horas del par BCH / USD (datos de Coinbase).
- El par podría continuar moviéndose hacia abajo si rompe los niveles de soporte de $ 128 y $ 125.
El precio en efectivo de Bitcoin está disminuyendo desde la zona de $ 135 frente al dólar estadounidense, a diferencia de Bitcoin. BCH/USD podría disminuir considerablemente si hay un movimiento por debajo de $125.
Análisis del precio en efectivo de Bitcoin
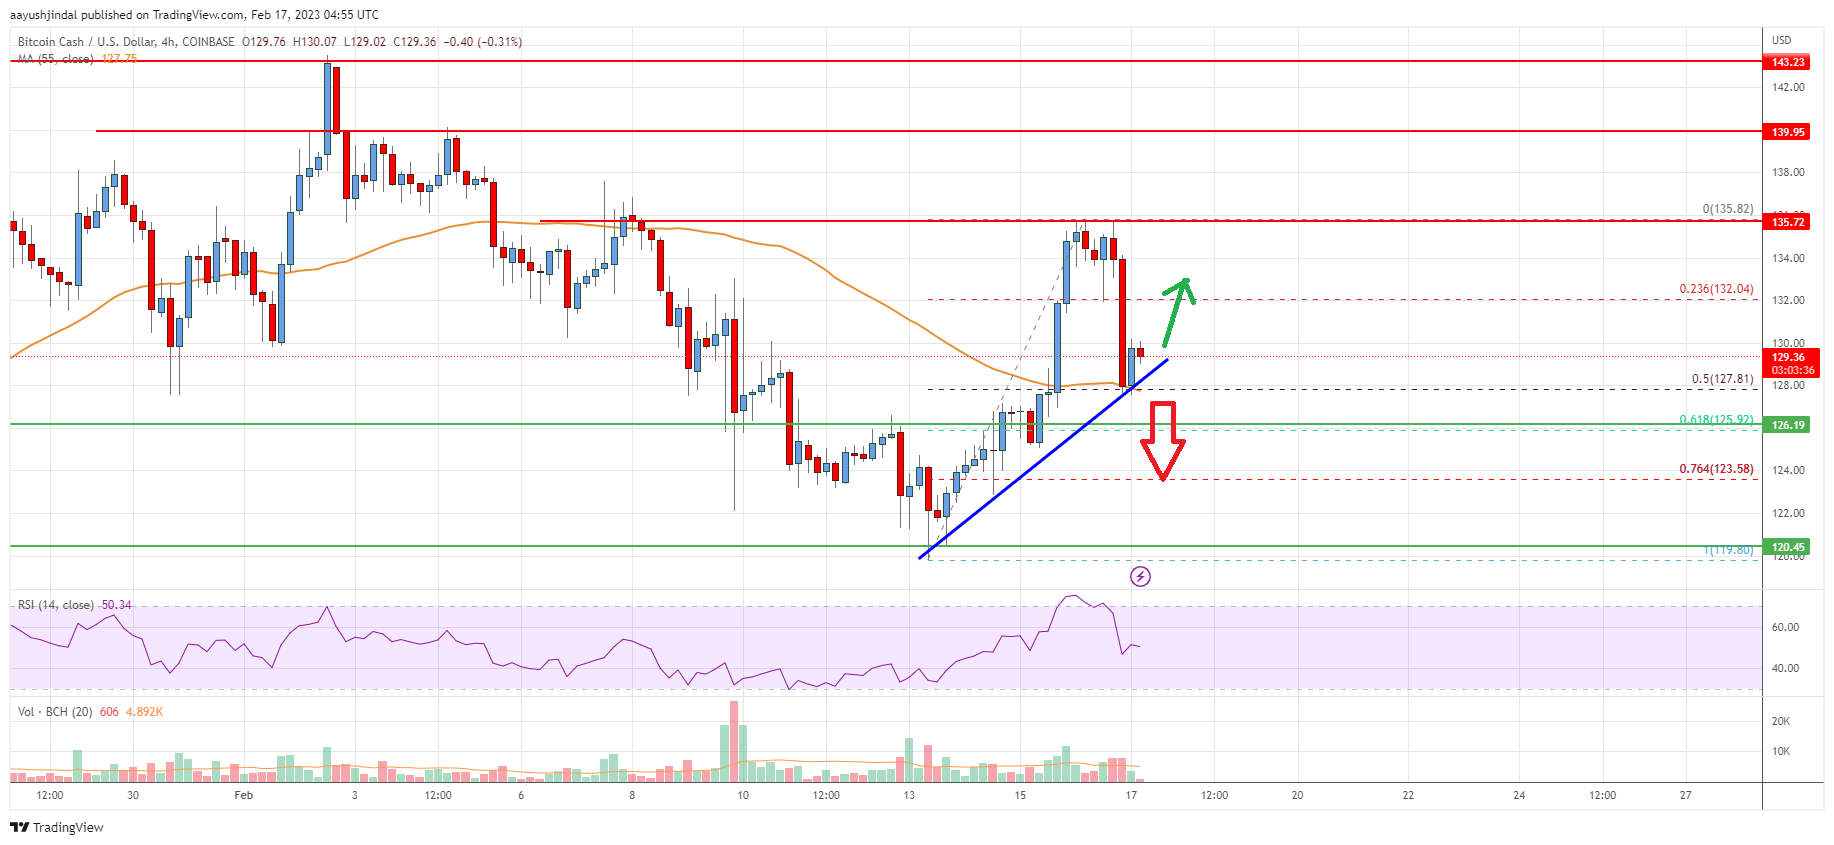
El precio en efectivo de Bitcoin luchó por ganar ritmo para un movimiento por encima de los niveles de resistencia de $ 135 y $ 136. BCH formó un máximo cerca de $ 135.82 y comenzó una nueva caída.
There was a clear move below the $134.00 and $132.00 support levels. The pair traded below the 23.6% Fib retracement level of the upward move from the $119 swing low to $136 high. The bears even pushed the price below the $130 support.
Ahora cotiza por encima de la zona de 125 dólares y el 55 promedio móvil simple (4 horas). There is also a key bullish trend line forming with support near $128 on the 4-hours chart of the BCH/USD pair.
An immediate resistance is near the $132 level. The main resistance sits near the $135 level. Any more gains above $132 and $135 could set the pace for a move towards the $142 level. If there is a move above the $142 resistance, the price could rise towards the $150 zone.
If not, the price might continue lower below the trend line support and $128. An immediate support on the downside is near the $126 zone. The next major support is near the $125 level, below which the bears might aim $120. The next target for them may perhaps be near the $115 level.

Precio en efectivo de Bitcoin
En cuanto al gráfico, bitcoin cash price is now trading above the $125 zone and the 55 simple moving average (4-hours). Overall, the price could continue to move down if it breaks the $128 and $125 support levels.
Los indicadores técnicos
MACD de 4 horas: el MACD para BCH / USD está ganando ritmo en la zona bajista.
4 horas RSI (Índice de fuerza relativa): el RSI para BCH / USD está cerca del nivel 50.
Niveles de soporte clave: $ 128 y $ 125.
Niveles de resistencia clave: $ 132 y $ 135.
Tags: BCH, Bitcoin Cash
 es.bitcoinethereumnews.com
