فشل Cardano في trac المستخدمين الجدد
ظلت عناوين مستخدمي Cardano ذات الرصيد راكدة عند حوالي 4.45 مليون لمدة عام تقريبًا، وفقًا لبيانات IntoTheBlock . ويأتي هذا التباطؤ في الوقت الذي يجذب فيه Solana وBase اهتمامًا متزايدًا من المستخدمين الجدد.
وفقًا لمحلل العملات المشفرة ميلك رود، زاد عدد العناوين النشطة Solana بمقدار 4 مرات تقريبًا في عام 2024. وفي 6 أغسطس، أضاف سولانا ما يقرب من 300 ألف عنوان جديد بدون تصويت.
تجاوزت العناوين النشطة الأسبوعية على @Solana 10 ملايين في بداية أغسطس لتهدأ مع انخفاض السوق مؤخرًا
لا يزال هذا ما يقرب من 4x منذ بداية العام
نمو مجنون منذ بداية العام pic.twitter.com/rLVyjcM1SE
— ميلك رود (@MilkRoadDaily) 12 أغسطس 2024
Despite the competition, Cardano reportedly maintained its transaction count and active user base since April. The network notes $7.2 billion in daily on-chain volume and a low network value to transactions (NVT) ratio of 2.62. Additionally, ADA held by long-term holders has reached an all-time high with 40% of the total supply.
But the development growth is nowhere at the levels of the last cycle. According to Token Terminal, Cardano’s code commits in August 2024 are at 338, registering a 74.5% drop month-on-month as July stood at 1.33k commits. The core developers in the 30-day period are also down almost 9% to 95. The figures come against the backdrop of Chang hard fork which aims to increase coordination between nodes.
Contrarily, Ethereum’s development has accelerated in the last month with code commits increasing by 14% to 1.11k.
ADA price down 20% in 30 days
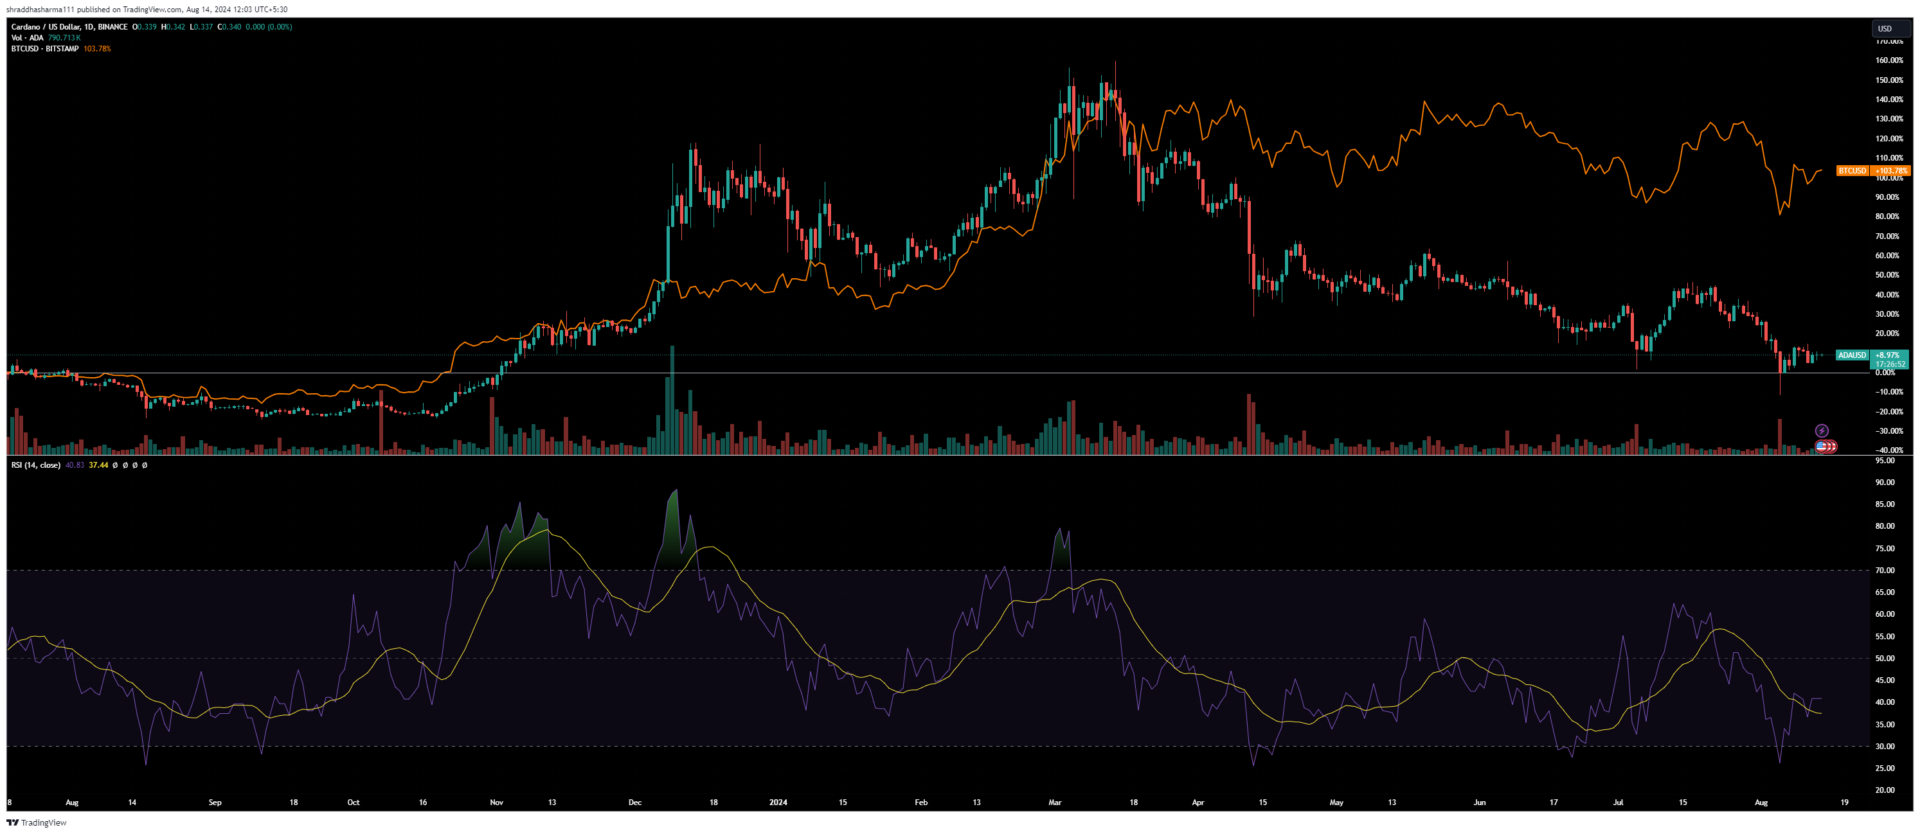
ADA price is on a recovery part on the weekly and daily charts after losing almost 23% value in 30 days.
However, the Cardano native is still down almost 90% from its record peak of $3. ADA surpassed the $0.7 price level in March this year before coming down to the range of $0.3 in August in almost a 60% drop.

Crypto influencer Bitcoinsensus notes signs of potential recovery due to a bullish pennant pattern on the charts. The pattern often follows a period of consolidation before a breakout.
The relative strength index (RSI) also indicates a reversal from the oversold zone. The RSI at the time of writing has stabilized at 40 in the last 3 days. There seems to be a potential for a reversal if the RSI continues to rise with bullish momentum.
