
After eight successive bearish candlesticks since June 7, Bitcoin (BTC) created a bullish candlestick with a long lower wick on June 15.
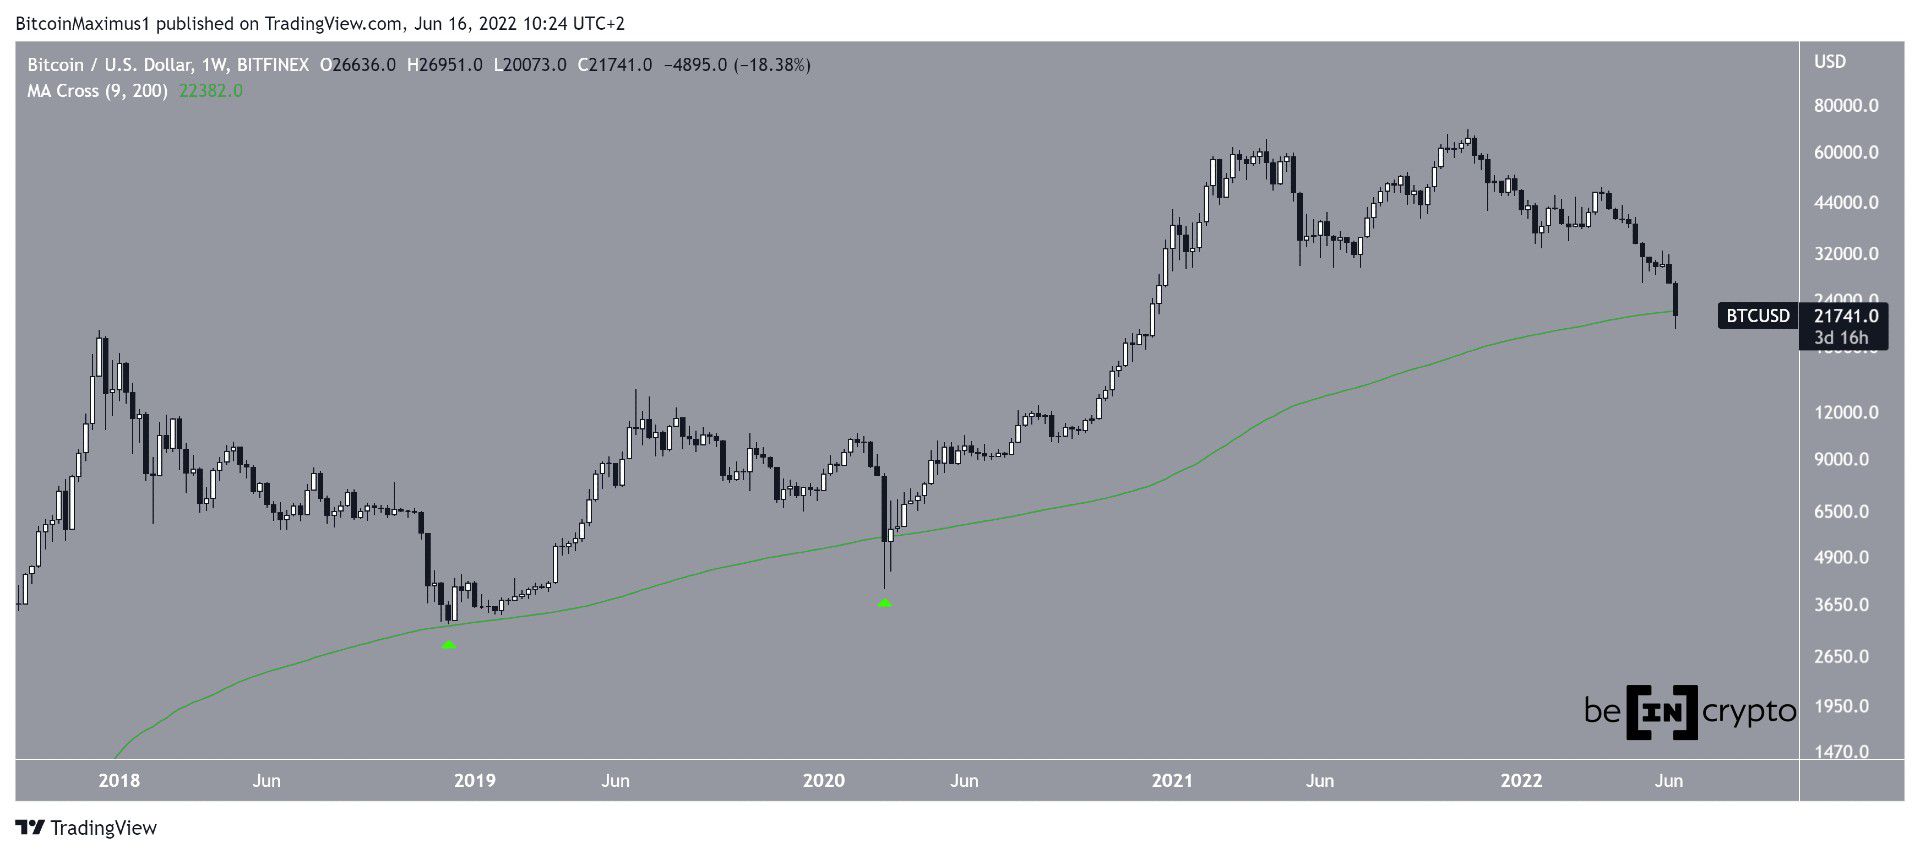
BTC has been decreasing since reaching an all-time high price of $69,000 in Nov. Until now, the downward movement has led to a low of $20,715 on June 15.
An important development is the fact that the price has reached its 200-day moving average (MA). The MA was also reached in Dec 2018 and March 2020. Both these levels marked absolute bottoms after which a significant upward movement followed.
Despite several long lower wicks, the price has never reached a weekly close below this MA, which is currently at $22,300.
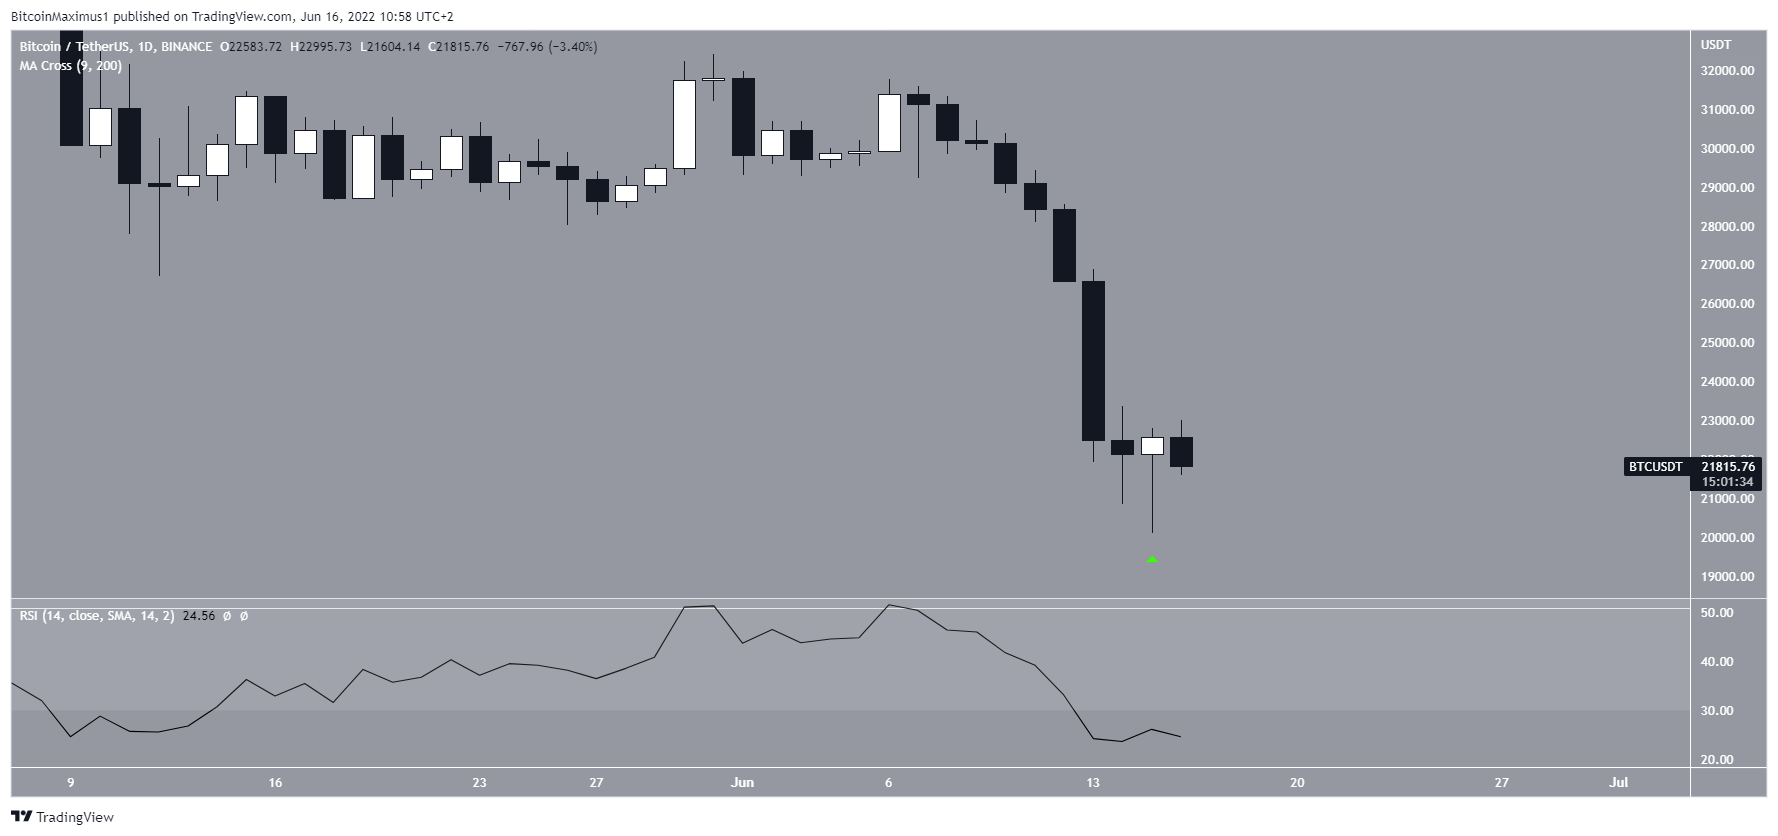
Daily hammer candlestick
On June 15, the price created a bullish hammer candlestick, which is characterized by a long lower wick and subsequent bullish close.
Since the candle is coming after such a sharp fall, it bodes well for the possibility of a reversal, especially if the price manages to create several successive bullish candlestick.
But, while the RSI is oversold at 22, it has not generated any bullish divergence yet.
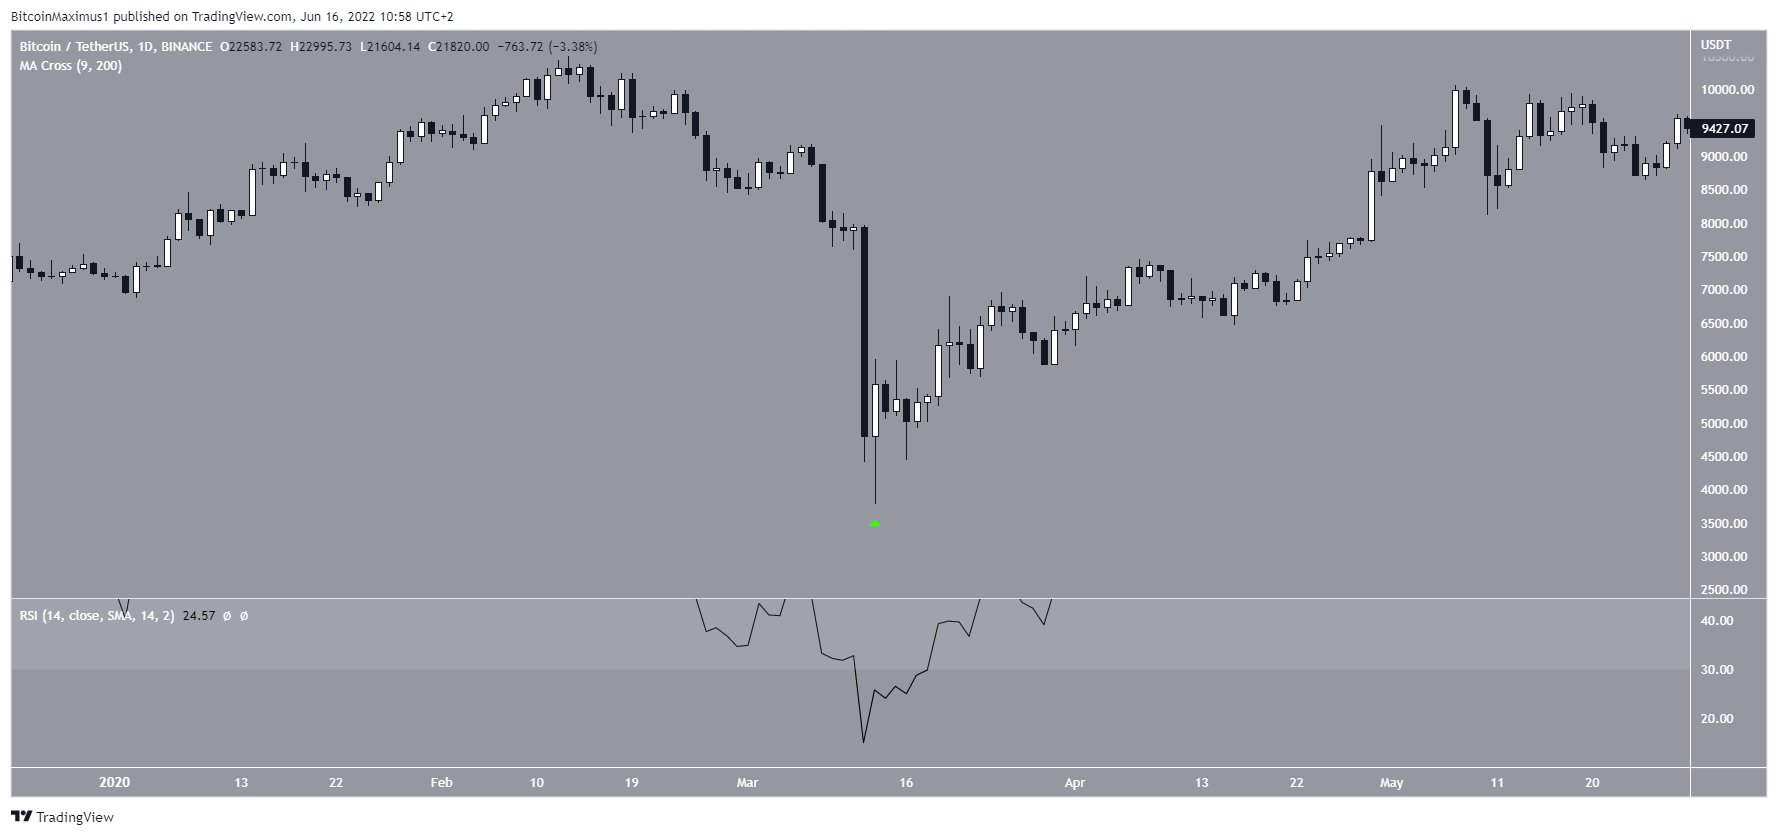
The candle holds similarities to that of March 13 2020, when a similar bullish candlestick was created after a sharp fall and a RSI of 15, which albeit did not have any bullish divergences.
Short-term BTC movement
The short-term count suggests that the price has possibly completed a five wave downward movement. The sub-wave count is shown in yellow, in which waves A:C have had an exact 1:1 ratio.
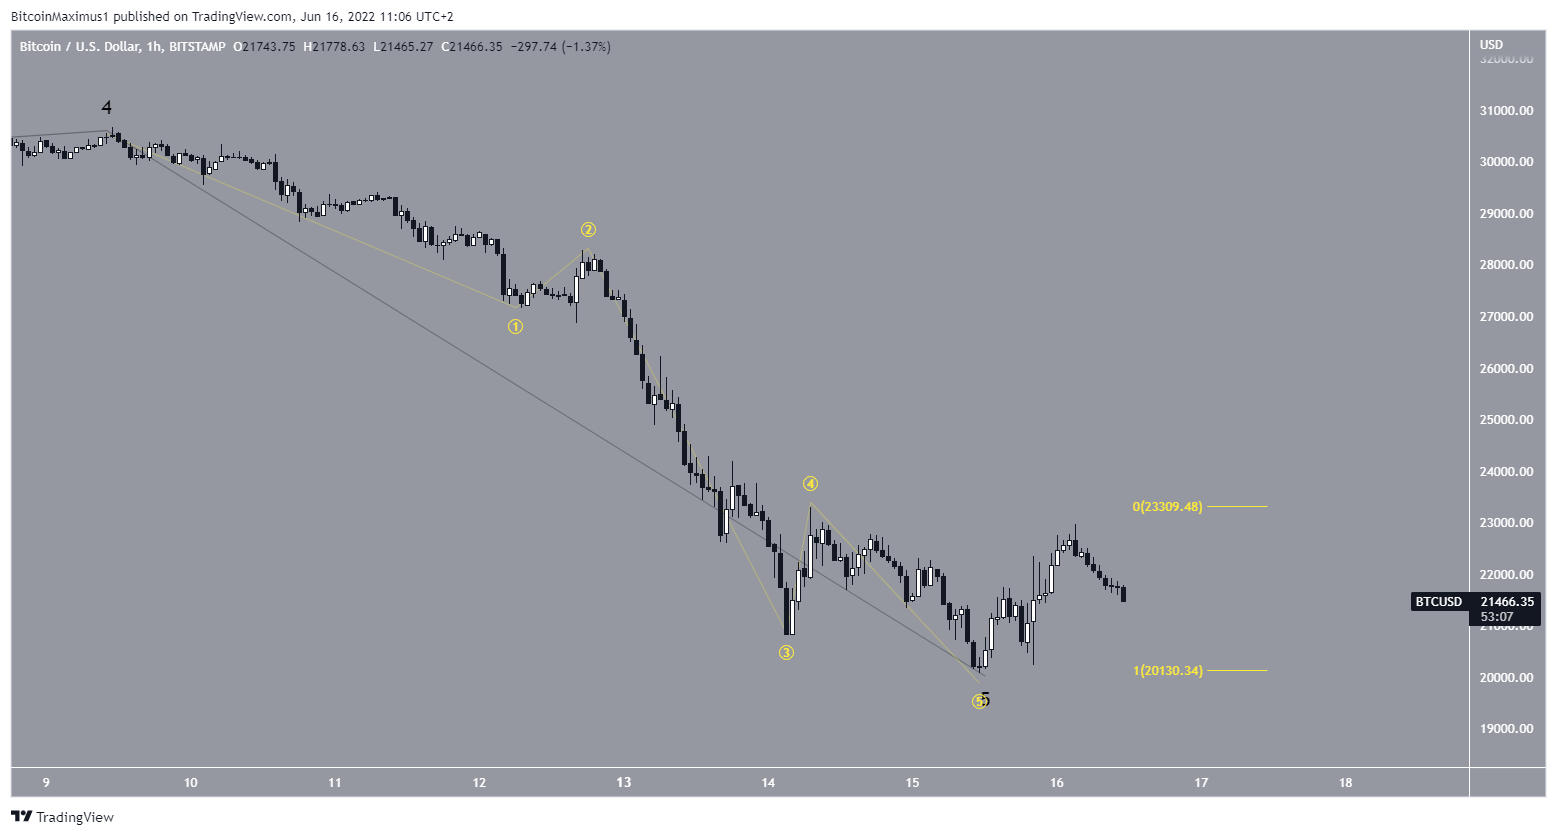
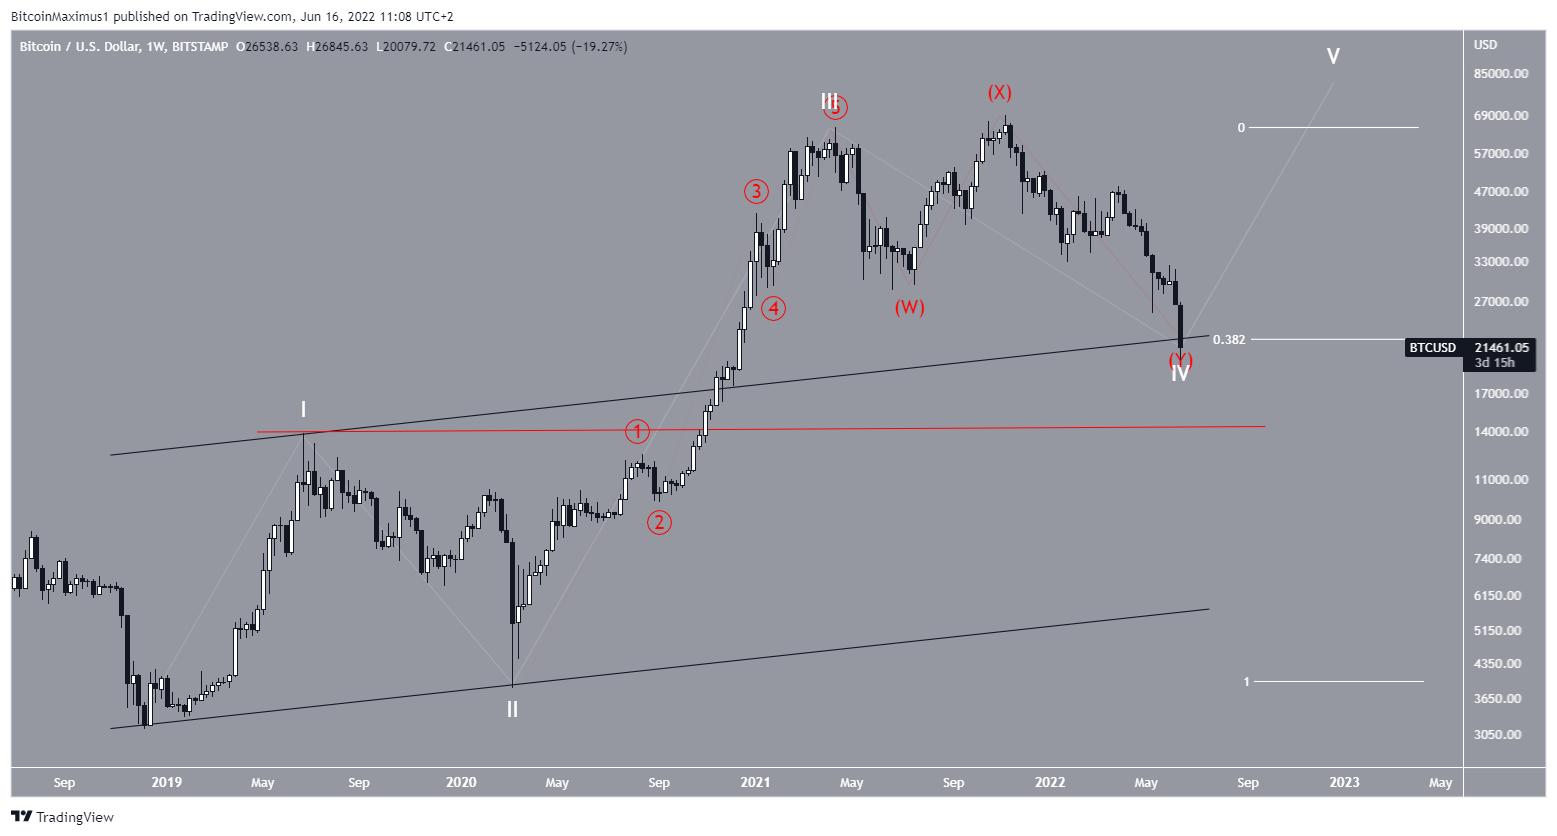
As for the long-term count, it is still possible that the price is at the bottom of wave four (white) of a five-wave upward movement. It has bounced at the:
- 0.382 Fib retracement support level
- Resistance line of the previous ascending parallel channel.
However, a continued decrease below the wave one high (red line) at $13,880 would invalidate this particular wave count.
For Be[in]Crypto’s previous bitcoin (BTC) analysis, click here