- Bullish XLM price prediction ranges from $0.52 to $0.82.
- XLM price might also reach $1 soon.
- XLM bearish market price prediction for 2021 is $0.316.
In Stellar (XLM) price prediction 2021, we use statistics, price patterns, RSI, and much other information about XLM to analyze the future movement of the cryptocurrency.
According to CoinGecko, the Stellar price is trading at $0.298 with a 24-hour trading volume of $$740,492,059, at the time of writing. However, XLM has decreased by 4.9% in the last 24 hours.
Currently, XLM trades in cryptocurrency exchanges such as Binance, Huobi Global, OKEx, CoinTiger, and FTX.
Stellar (XLM) Price Prediction 2021
Stellar (XLM) price prediction 2021 explained below in the weekly time frame.
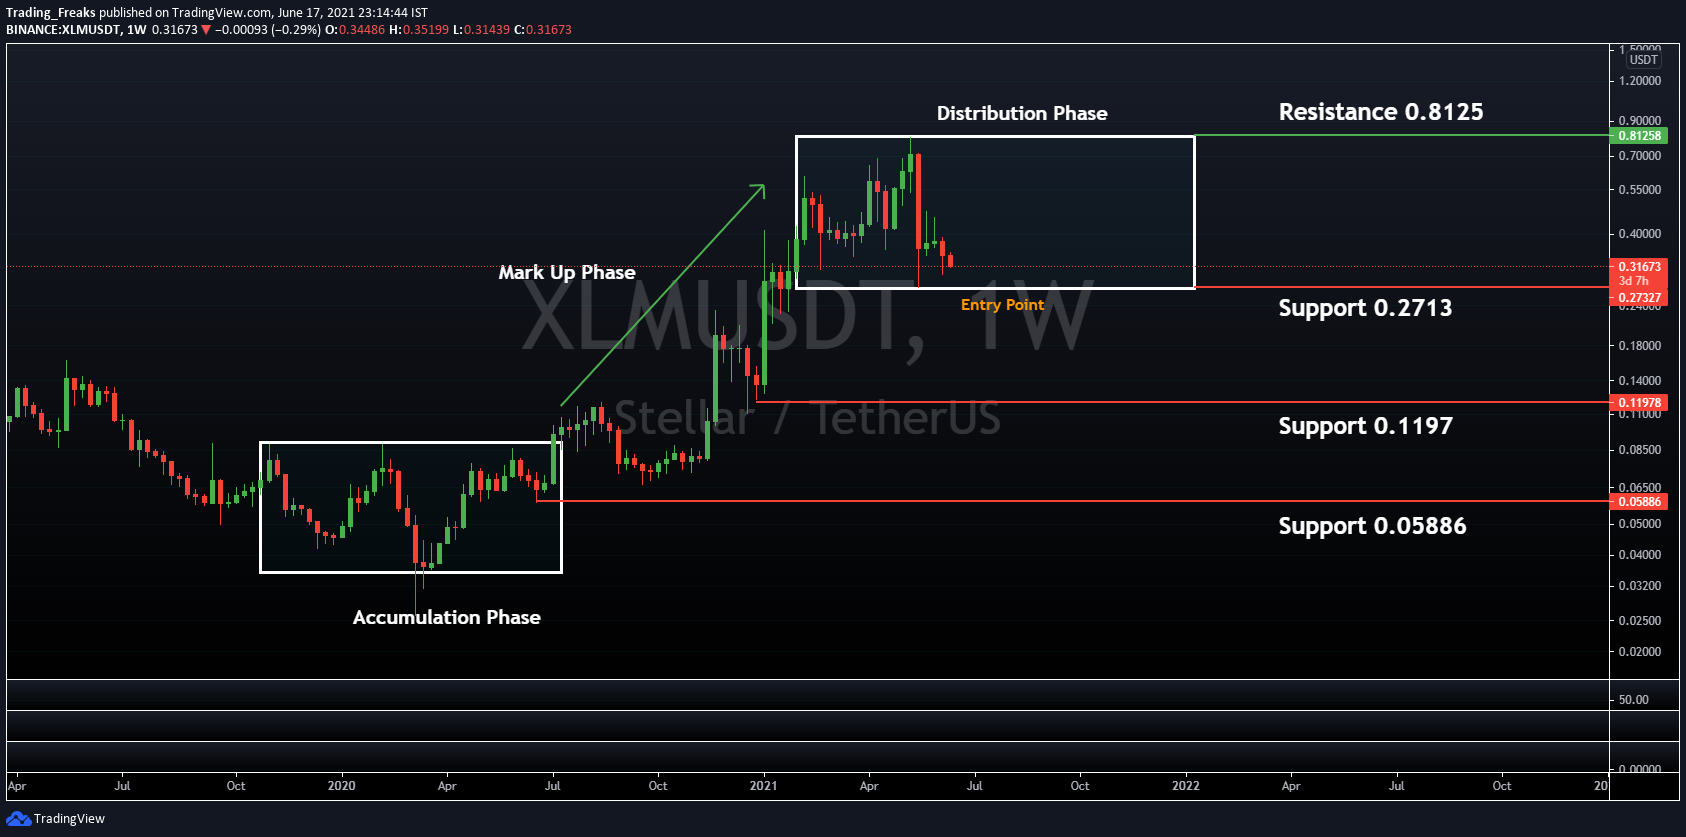
Wyckoff theory explains that every cause in the market will proceed to a proportional effect. However, this can be described using accumulation and distribution phases.
Accumulation: This phase represents Markup and price increases. Notably, the price spikes when the token breaks the accumulation resistance. As per the chart above, the chart signal begins with the accumulation phase which could also be said as lower price buy level.
Markup: During the markup phase, price breaks out of a certain range and starts a sustained uptrend. More so, an uptrend is defined as a series of higher pivot highs and higher pivot lows. As shown in the above chart the crypto enters the markup phase after the accumulation. This stage will start when the price begins moving up.
Distribution: Distribution leads to Markdown and the price decreases. For instance, the price falls when the token breaks the support. As per the chart, the crypto enters this phase after the markup phase. At this level, the price maintains its position in a certain range.
Markdown: During the markdown phase, price breaks out of a certain range and starts a sustained downtrend. More so, an uptrend is defined as a series of lower pivot lows and lower pivot highs.
Currently, XLM is in the distribution phase, if it breaks the higher level and crosses $0.8125, if the trend continues it indicates bullish days ahead. In contrast, if it breaks the low level, it could reach $0.27. However, if the trend continues then it indicates bearish. Then again the signal enters the mark down phase. It enters into the accumulation phase once again.
Stellar (XLM) Support and Resistance Level
The below chart shows the support and resistance level of Stellar (XLM).
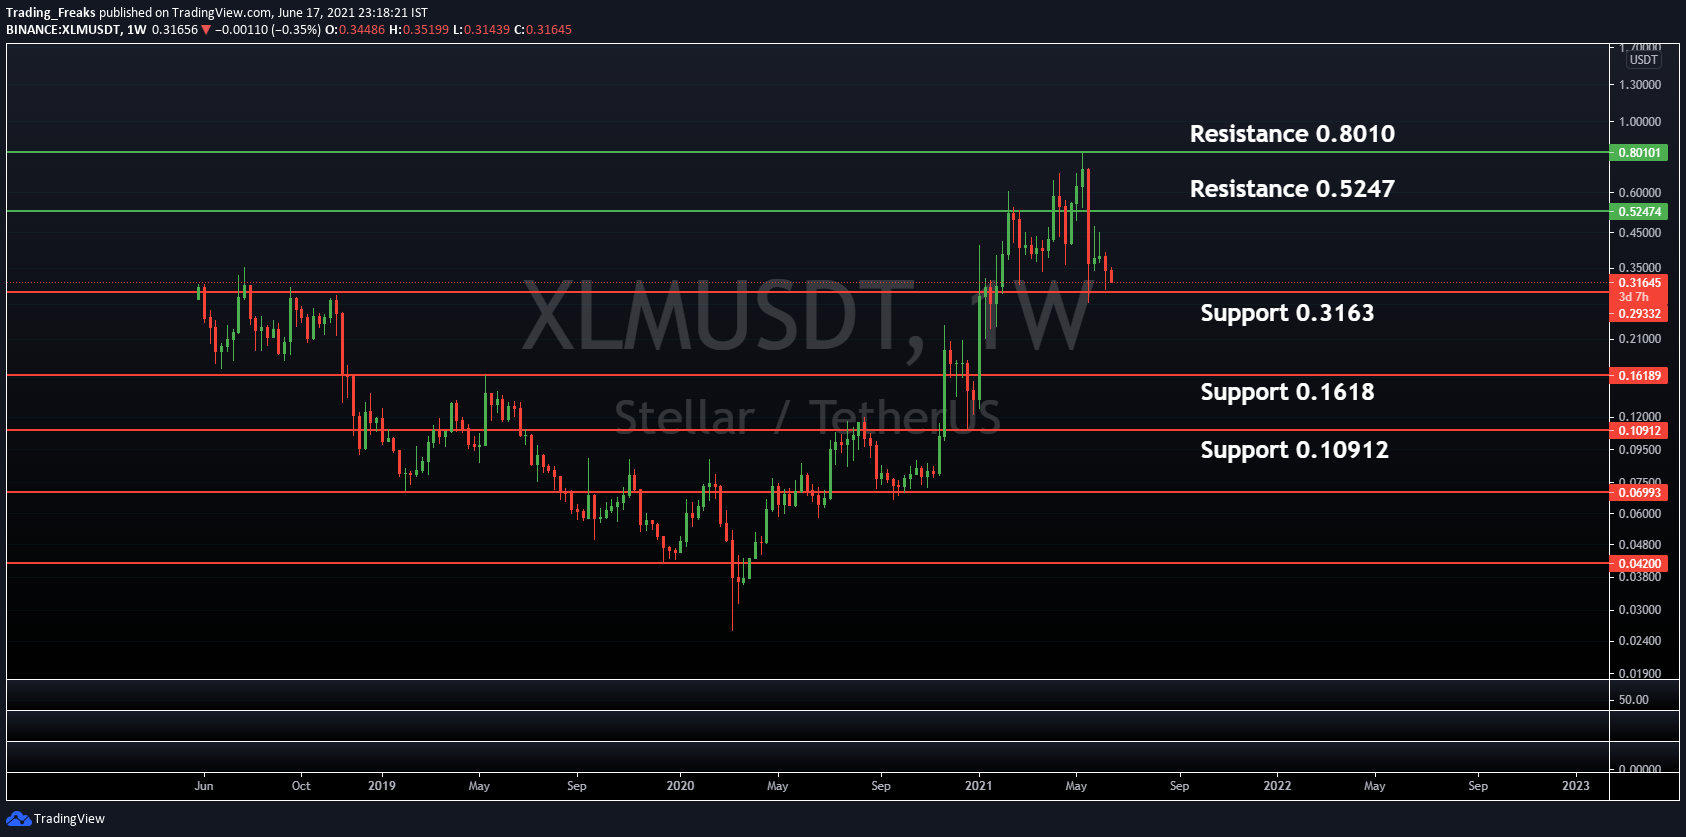
From the above time frame, it is clear the following are the resistance and support level of XLM.
- Resistance Level 1 – $0.524
- Resistance Level 2 – $0.801
- Support Level 1 – $0.316
- Support Level 2 – $0.1618
- Support Level 3 – $0.109
The chart indicates that XLM shows bullish performance over the past month. However, if the trend continues, XLM might run along the bulls overtaking its resistance level at $0.8. In contrast, if the investors turn against the crypto, the price of XLM might plummet to almost 0.109, a bearish signal.
Stellar (XLM) Average Directional Index (ADX)
Now let us focus on the Average Directional Index (ADX) of XLM. Notably, the ADX helps traders to determine the strength of a trend, rather than its actual direction. More so, it can be utilized to find whether the market is changing or a new trend begins. However, it is associated with the Directional Movement Index (DMI).
Evenmore, the range of the oscillator is from 0 to 100. Added to this, a high value indicates a strong trend, and a low value represents a weak trend. Moreover, it is mostly combined with directional indicators.
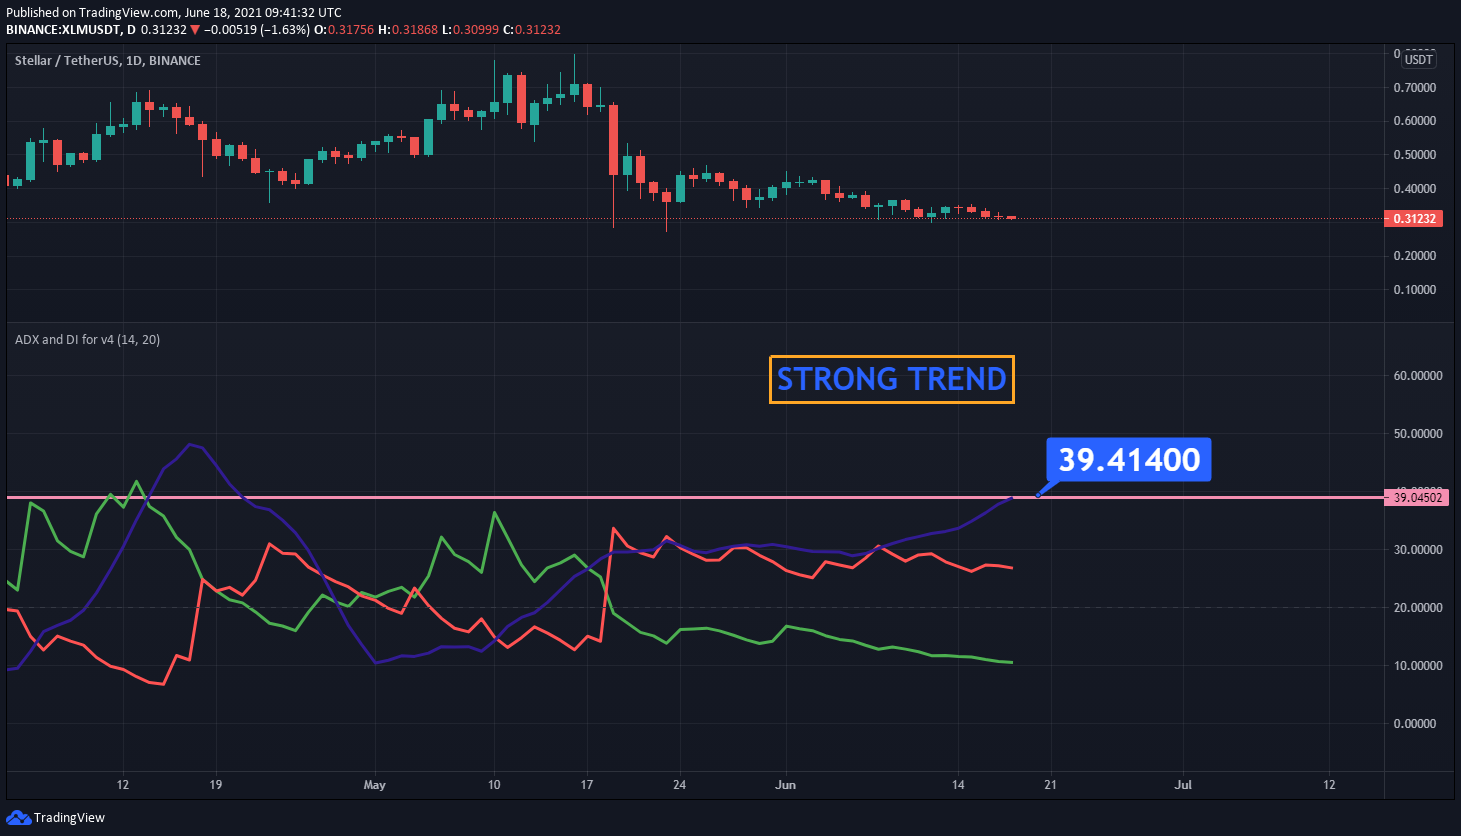
The above chart shows the ADX of XLM stays above the range of 39, so it indicates a strong trend that is on the sell side.
Conclusion
The XLM is one of the cryptos that keeps its ground against the bearish market. Furthermore, our long-term XLM price prediction 2021 is bullish. It has a huge possibility of overtaking its current all-time-high (ATH) of $0.93 this year. However, this will only happen if it breaks many previous psychological resistances.
Furthermore, with the ongoing developments and upgrades within the XLM ecosystem, it could experience a great future ahead in 2021. It may reach 0.8 soon and it might even reach high heights, however reaching $1, if investors have planned that XLM is a good investment in 2021.