Today has been a rough day for Bitcoin bulls. The price dropped by a sharp 10% today, over $4K, over the past hours. This comes just one day after the primary cryptocurrency reached $38K. In conclusion – we saw a 2-day nightmare of almost $7000 loss in value.
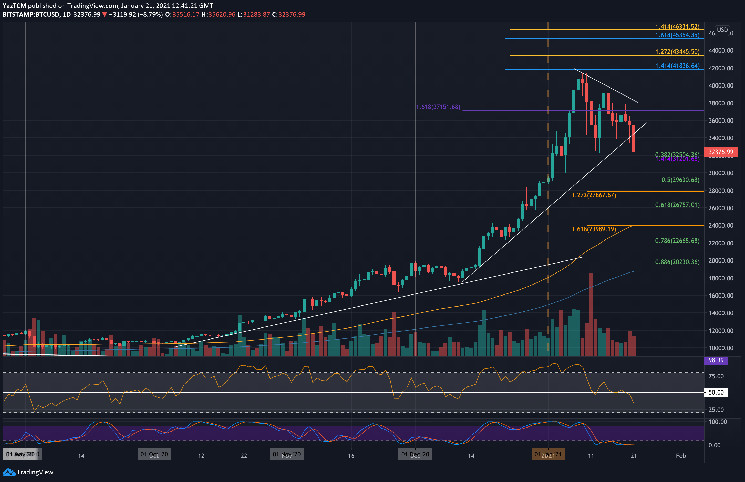
What leveraged the collapse was the horizontal triangle’s breakdown, as mentioned here in our most recent $BTC analysis from yesterday. As can be seen on the daily chart below, once the triangle was broken along with horizontal support of $34K, the bloodbath began.
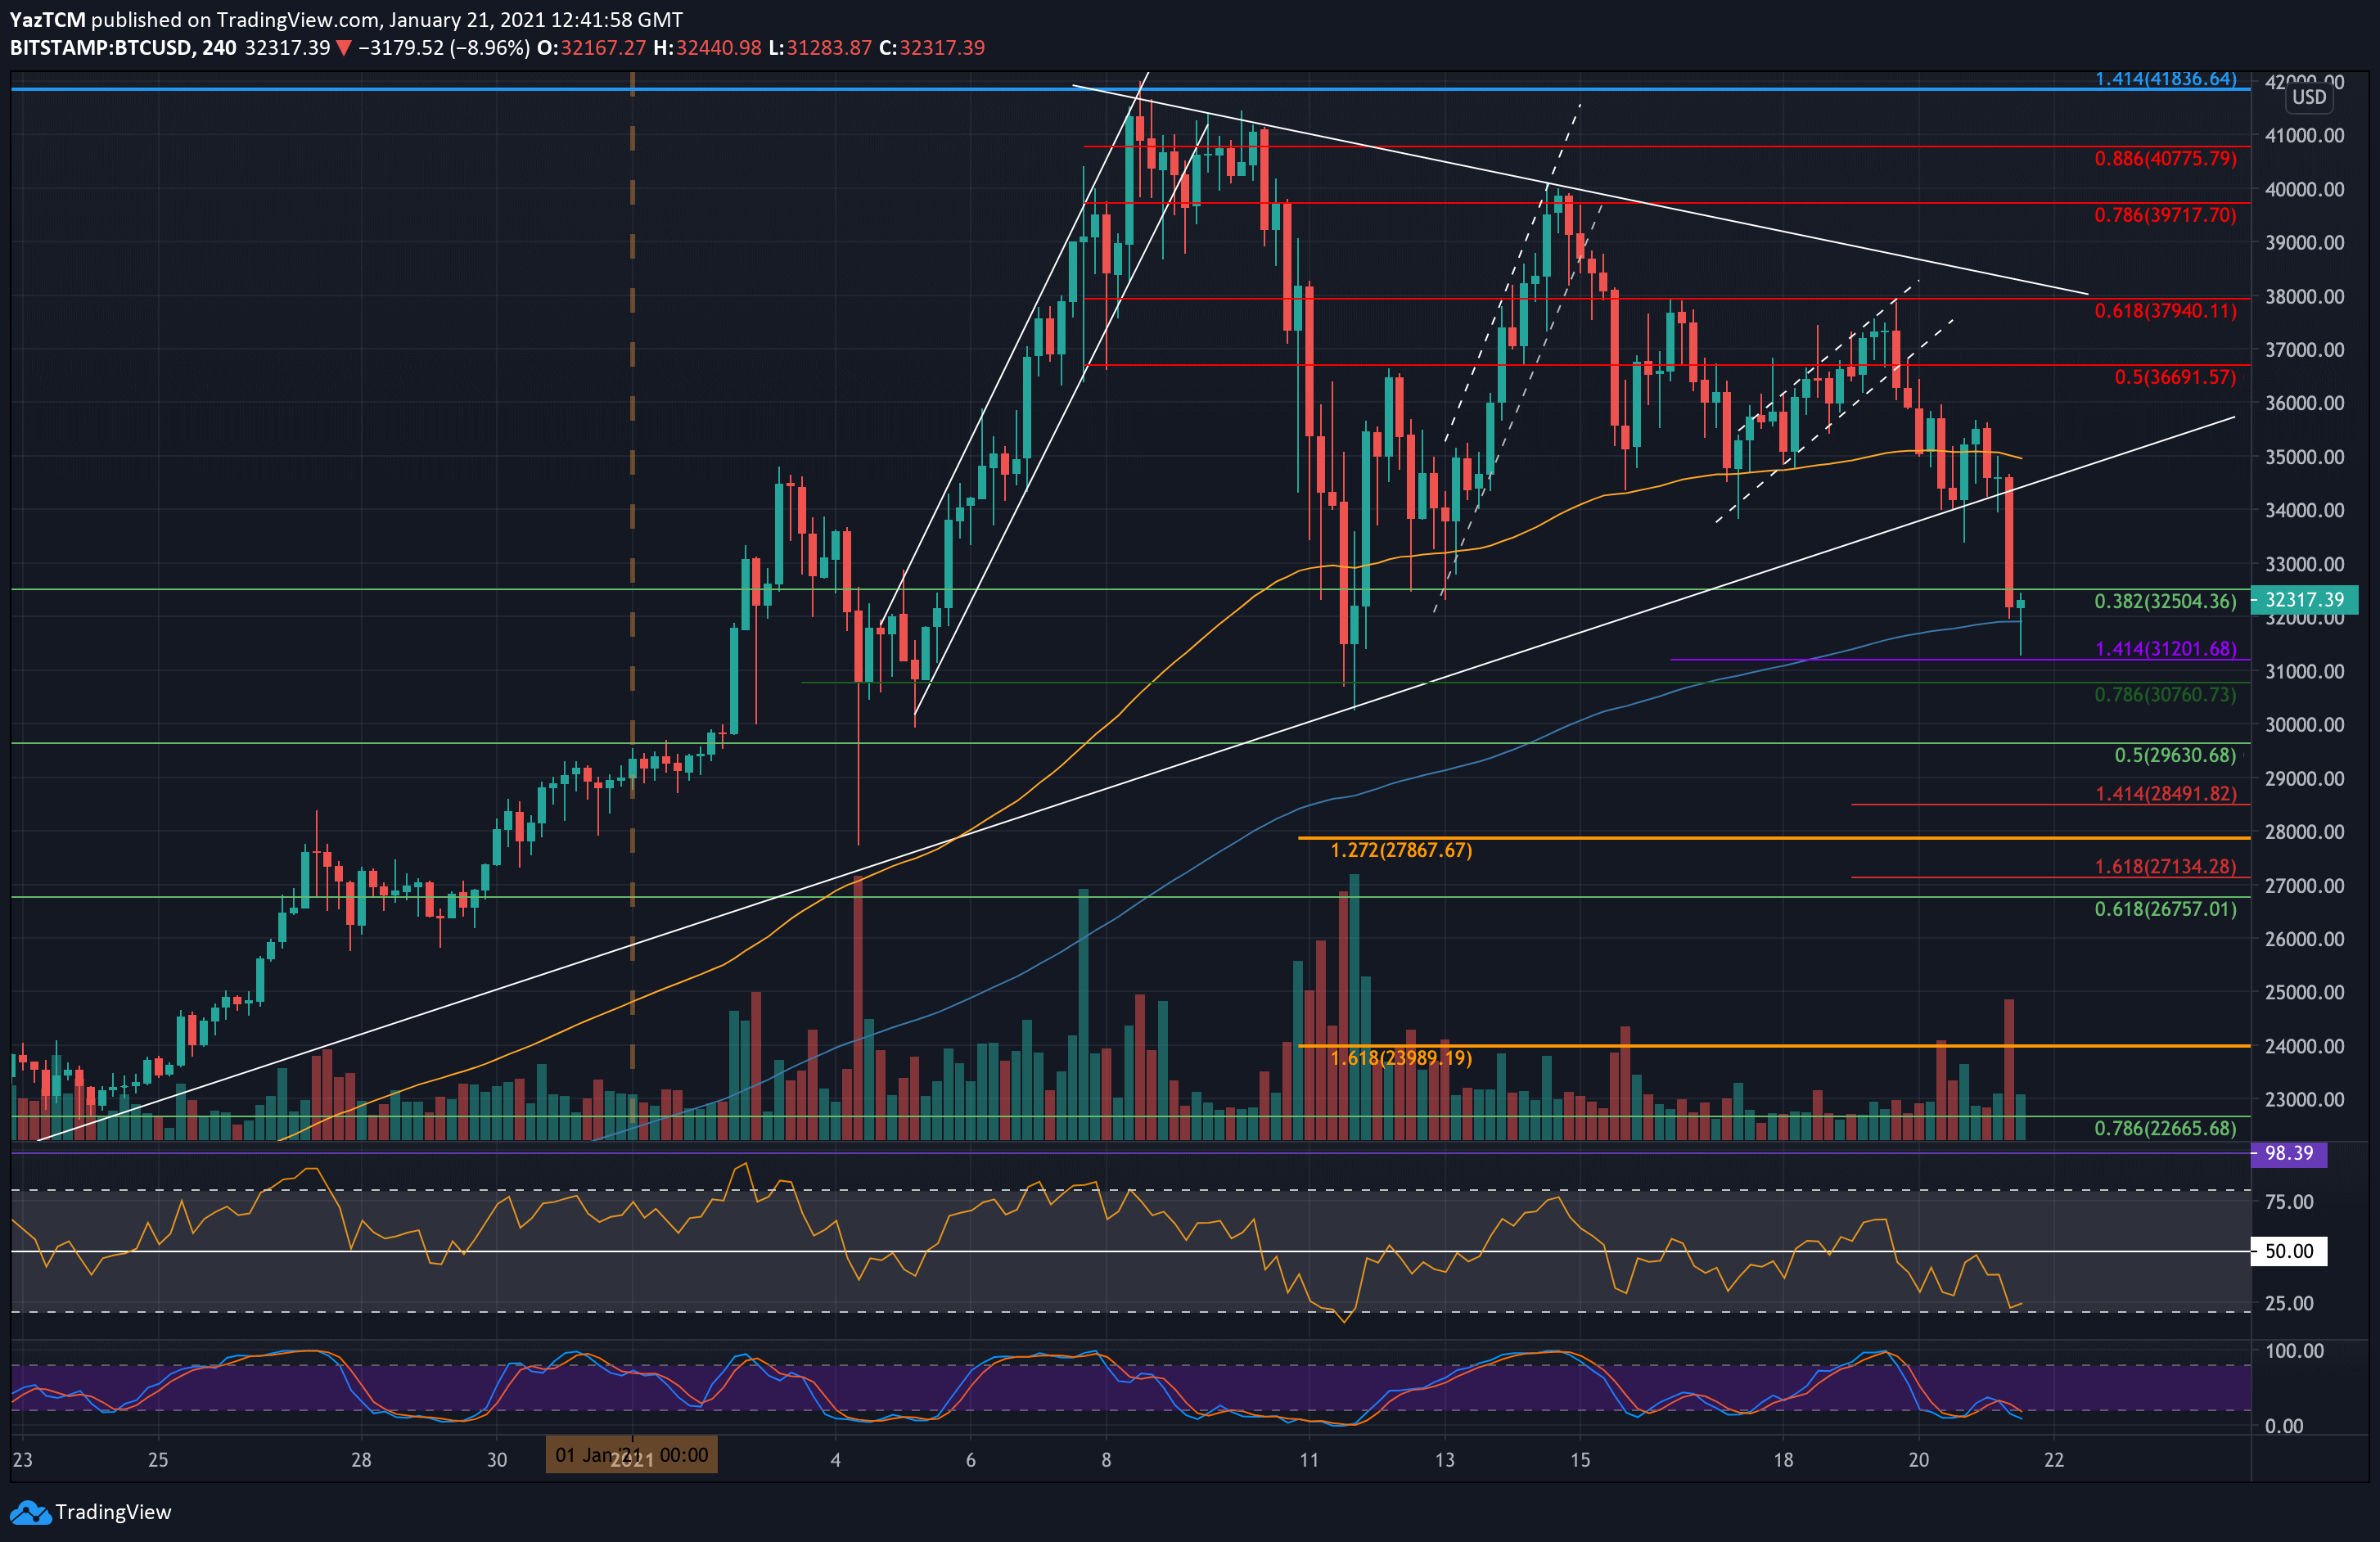
As of writing these lines, the daily low (according to Bitstamp) lies about the support area at $31,200, which is the downside 1.414 Fib Extension level.
Shortly after recording the current low at $31,200, the bulls had come and a massive correction above was initiated. We should pay attention to the triangle’s breakdown level at $34K. In case today’s candle will close above it, then the mid-term bull trend might still be intact. From the other side, a retest and a failed attempt to breach mean one thing – the bears are in control for the upcoming short-term.
$BTC Price Support and Resistance Levels to Watch
Key Support Levels: $31,200 (today’s low), $30,760, $30,000 (last week’s low), $29,630, $28,500.
Key Resistance Levels: $32,500, $34,000, $34,800, $35,000, $36,000.
Looking ahead, if the bears continue to drive Bitcoin beneath $31,200, the first level of support lies at $30,760 (short term .786 Fib), as well as a strong support level from the past week. This is followed by $30,000 – last week’s low, $29,630 (.5 Fib), $28,500 (short term downside 1.414 Fib Extension), and $27,900 (downside 1.272 Fib Extension).
The next possible targets might be $26,757 (.618 Fib) and $26,000.
On the other side, the first level of resistance lies at $32,500. This is followed by $34,000, as mentioned above, $34,800 – $35,000. Further resistance is located at $36,690 and $37,940 (yesterday’s top).
The Daily RSI has now plunged into the bearish territory, indicating that the selling momentum is increasing rapidly. However, the Stochastic RSI oscillator both on the 4-hour and the 1-day chart are deep in the oversold area, which might trigger a correction.
Bitstamp $BTC/USD Daily Chart
Bitstamp $BTC/USD 4-Hour Chart