
The failed inverted head and shoulder pattern warns of $2800 fallout that can drive the ETH coin price back to the $2400 mark. The ETH coin price gives a fallout of the inverted head and shoulder pattern, as the bulls fail to overcome selling pressure at the $3200 and the resistance trendline. Will the bears break below the $2800 mark to give a 15% downfall?
Key technical points:
- Ethereum retests the $2800 support zone.
- The vortex indicator is on the verge of giving a bearish crossover.
- The 24-hour trading volume in the Ethereum token is $14.86 Billion, indicating a 2.42% rise.
Past Performance of ETH
As the bulls fail to surpass the $3200 mark, the Ethereum prices fall below the crucial support levels to reach $2800. The price action showcases a bearish reversal from the resistance trendline in the ETH/USD chart. Currently, the market price of Ethereum is $2,936 as the $2800 support pushes the prices higher back. 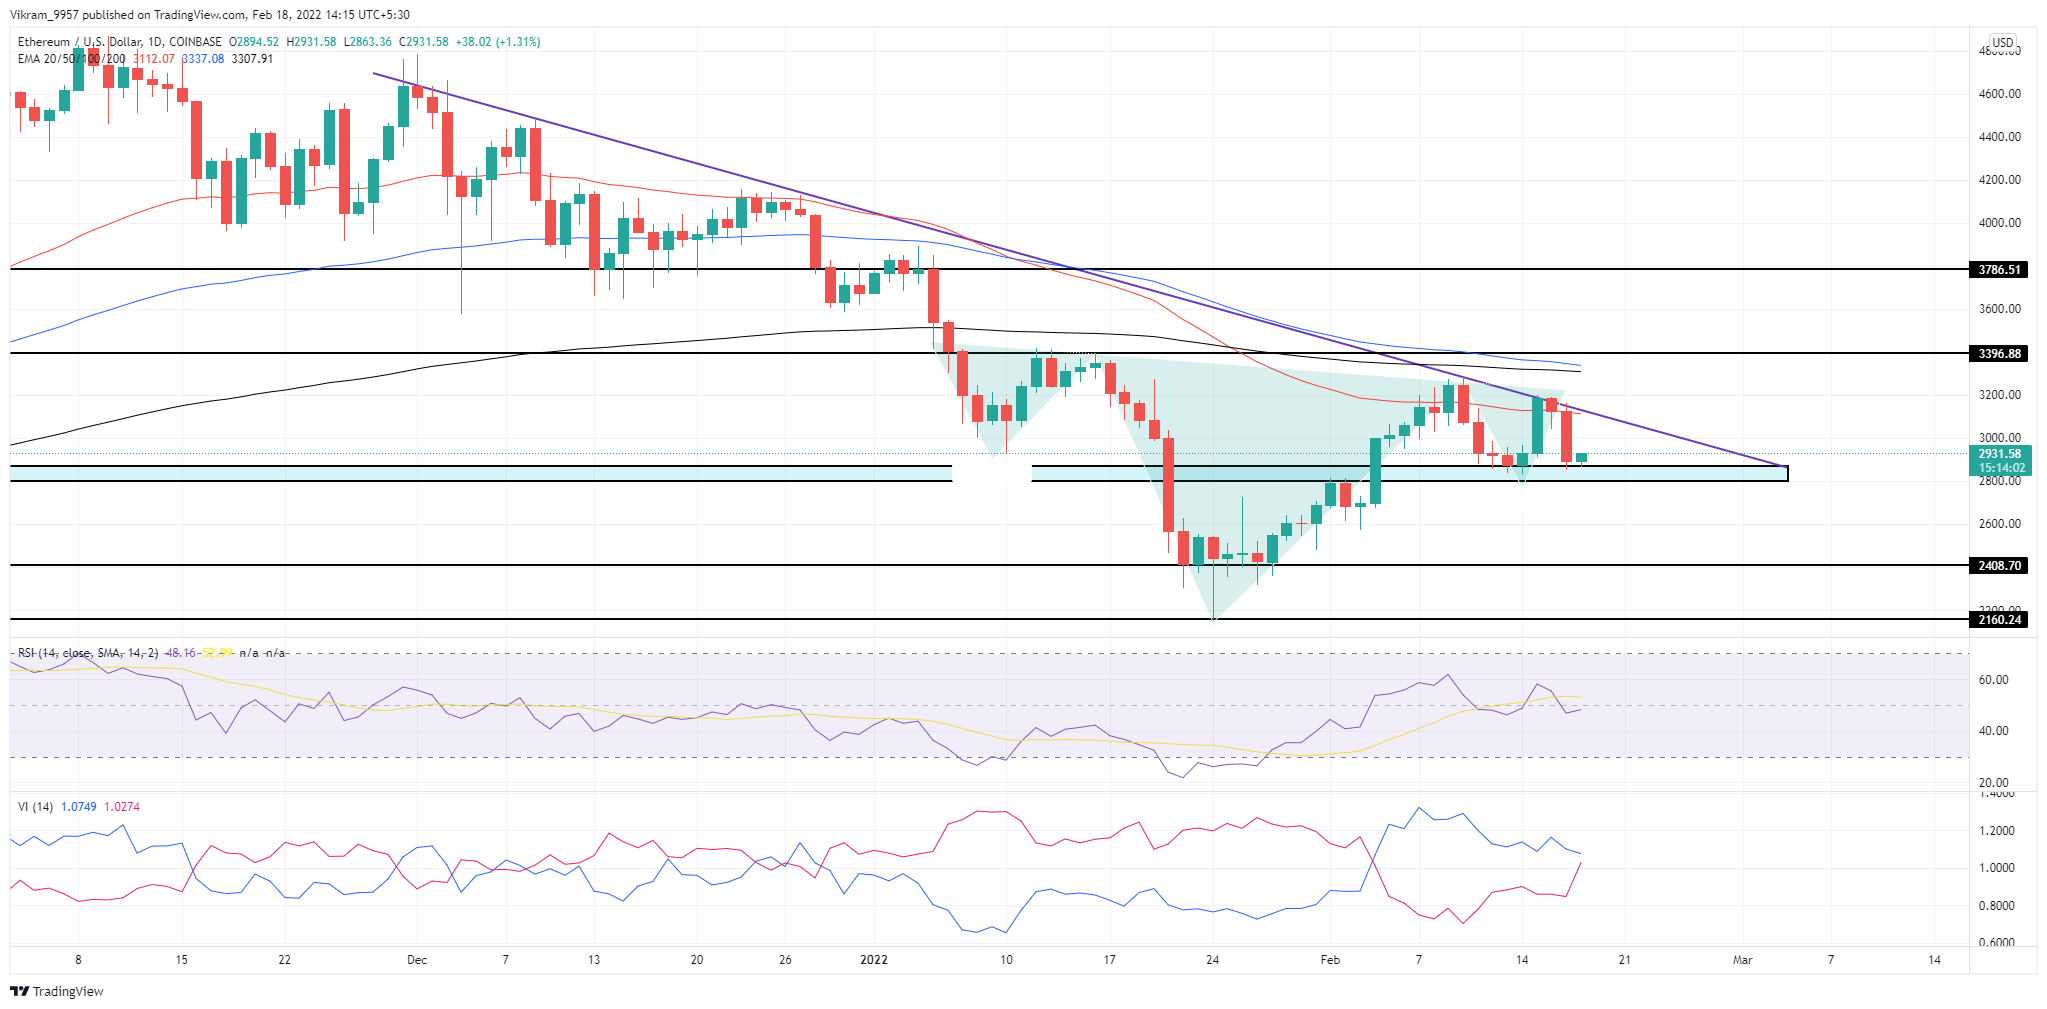 Source-Tradingview
ETH Technical Analysis
The crucial 50,100, and 200-day EMAs maintain a bearish as the ETH prices trade below all of them. Moreover, the falling 100-day EMA may shortly give a bearish crossover with the 200-day EMA. The RSI Indicator slope shows a bearish divergence in the last two dips at the $2800 support zone. Hence, the possibility of a double bottom creation and hints of fallout to the $2400 mark. The Vortex indicator suggests the VI lines approaching to give a bearish crossover, projecting the trend reversal possibility. Hence, the indicator showcases the bears gradually overtaking trend control in the ETH/USD chart. In a nutshell, the reversal from the descending trendline and the technical indicators project the possibility of a downfall to the $2400 mark.
Upcoming Trend
The ETH prices depreciate drastically in the past day, with an evening star pattern near the resistance trendline. Moreover, the failed inverted head and shoulder pattern reflects the exhaustion of bulls. Hence, the upcoming trend seems extremely bearish that may drive the fall to the $2800 mark. Support Levels: $2800 and $2400 Resistance Levels: $3400 and $3800