ADA coin price action forms a triangle pattern in the daily chart that may soon give a massive move upon breakout on either side.
Cardano, a proof of stake blockchain platform, claims its goal is to empower "changemakers," innovators, and visionaries to create positive global change.
Open-source projects also aim to "redistribute power from unaccountable structures to the margins to individuals." Thus, creating a more secure, transparent, and fair society.
Cardano was established in 2017 and named after Gerolamo Cardano, a 16th-century Italian polymath. The native ADA token gets its name from Ada Lovelace (19th-century mathematician), widely regarded as the first computer programmer in the world.
Let us now take a deep look into the technical analysis of Cardano's cryptocurrency.
Past Performance of ADA
Due to the sudden supply increase near the $3 mark, the ADA coin price fell more than 30% in the last month. However, the bullish support near the $2 mark has been helpful in an upside retracement.
Despite this, the ADA crypto price action forms a symmetrical triangle pattern in the daily chart. Thus, resulting in the formation of an inverted flag pattern.
Furthermore, the shrinking range of the price action indicates entrapment of the underlying momentum. Hence, a breakout of either side can be ginormous.
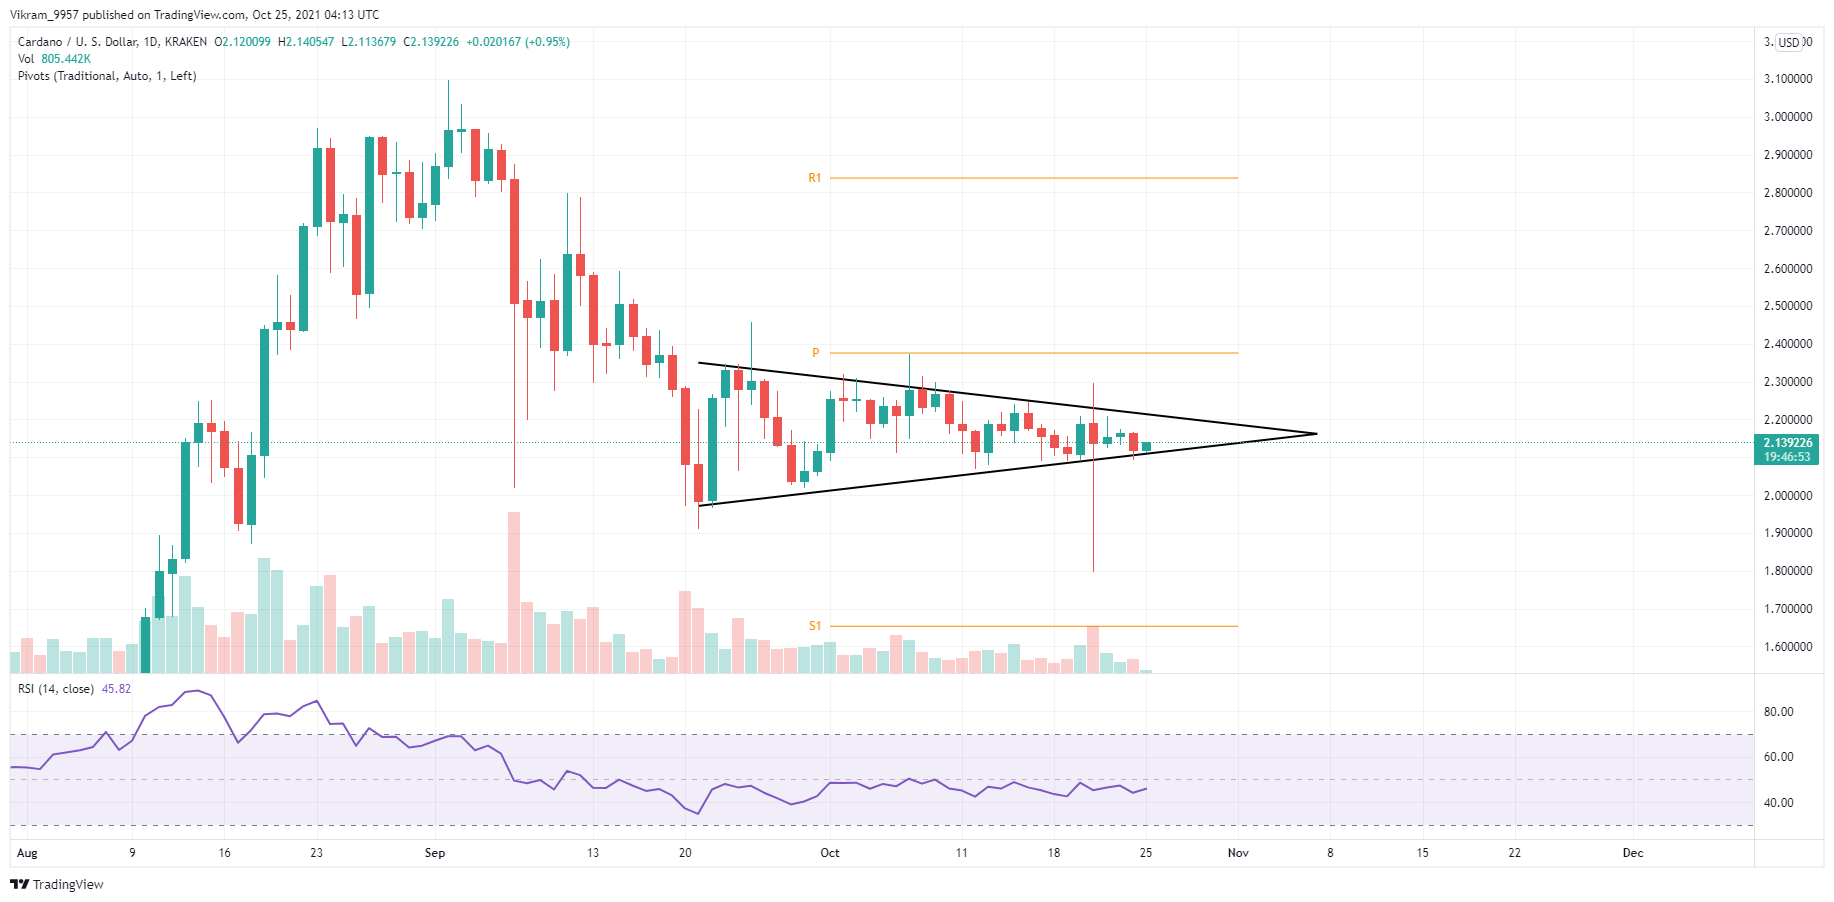
Source - Tradingview
ADA Technical Analysis
During press time, ADA coin price trades at $2.13, with a price fall of 0.82% in the past day. Furthermore, the trading volume stands at $2.26 billion with a jump of 10% compared to yesterday.
The $2.37 mark and the $2.87 mark are the upcoming obstacles in the bull run indicated by the Pivot Points. And on the flip side, the psychological support of $2 can act as a support level followed by the $1.65 pivot level.
The MACD indicator in the daily chart generates bearish signals. Due to the movement of MACD and signal lines in the negative segment. Furthermore, the lines may soon generate a selling signal crossover.
The RSI indicator projects a rise in draw between bullish and bearish powers as the slope moves sideways in close proximity to the central line.
Upcoming Trend
As per the technical analysis of Cardano cryptocurrency, the ADA coin price resonates deep into the triangle pattern. Hence, a breakout of either side can be decisive in the future trend.