Bulls are trying to be back in the game as most of the top 10 coins are rising.
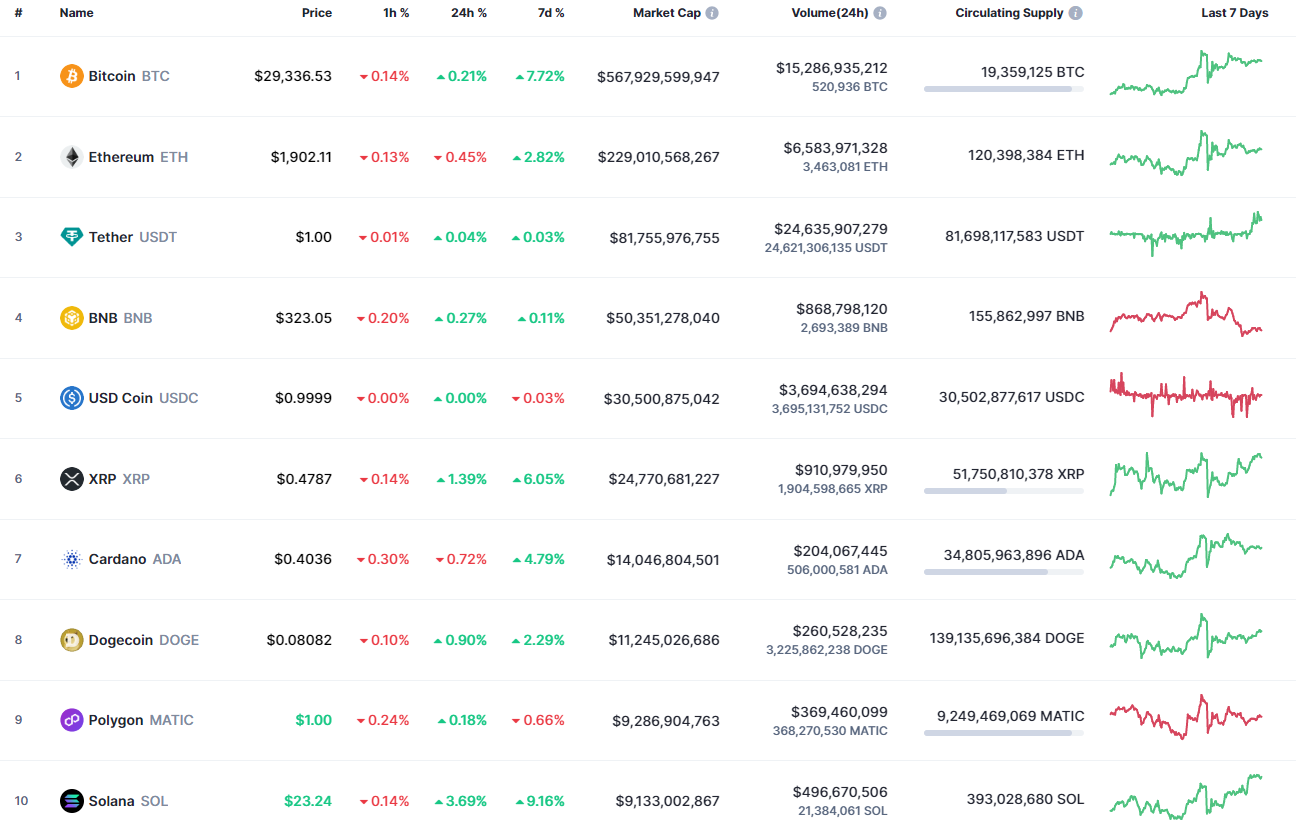
Top coins by CoinMarketCap
ETH/USD
Ethereum (ETH) has not followed the rise of other coins, going down by 0.45%.
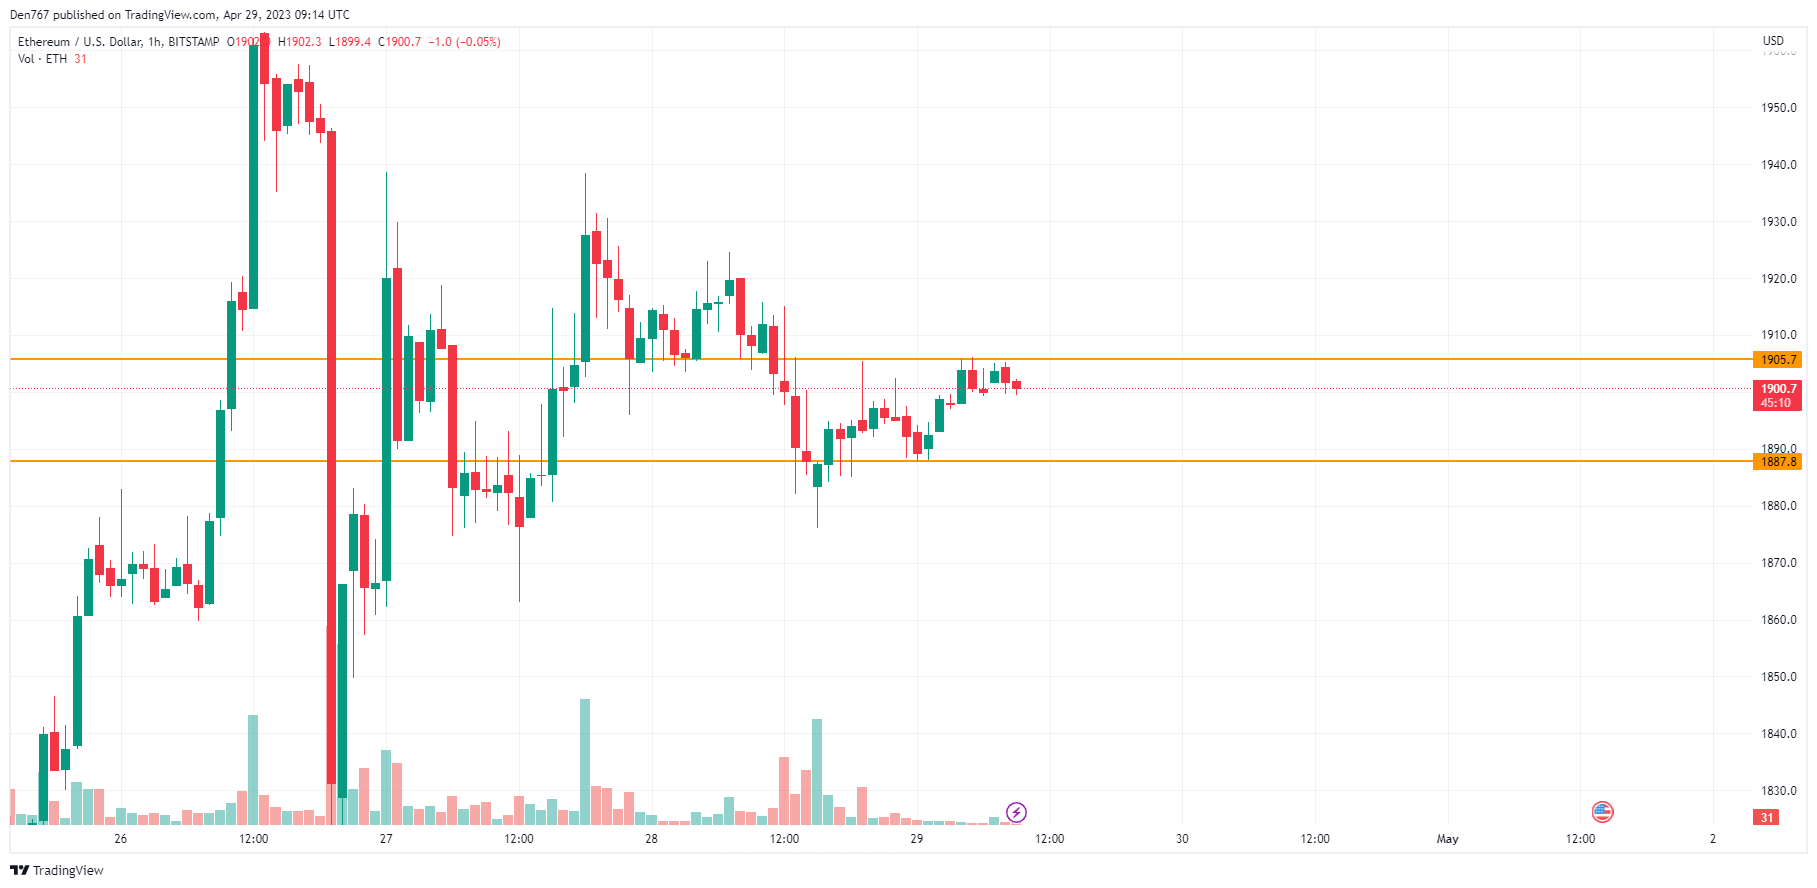
Image by TradingView
Despite the slight fall, Ethereum (ETH) is trading near the local resistance at $1,905. At the moment, the zone of $1,900 plays a key role in terms of a further altcoin move. If closure happens above it, there is a chance to see a breakout followed by a blast to the $1,920 area.

Image by TradingView
On the daily chart, the situation remains unclear as the price keeps trading sideways between the support at $1,802 and the resistance at $1,982. Declining volume confirms the absence of buyers and sellers on the market.
Respectively, ongoing consolidation in the area of $1,860-$1,960 is the more likely scenario for next week.
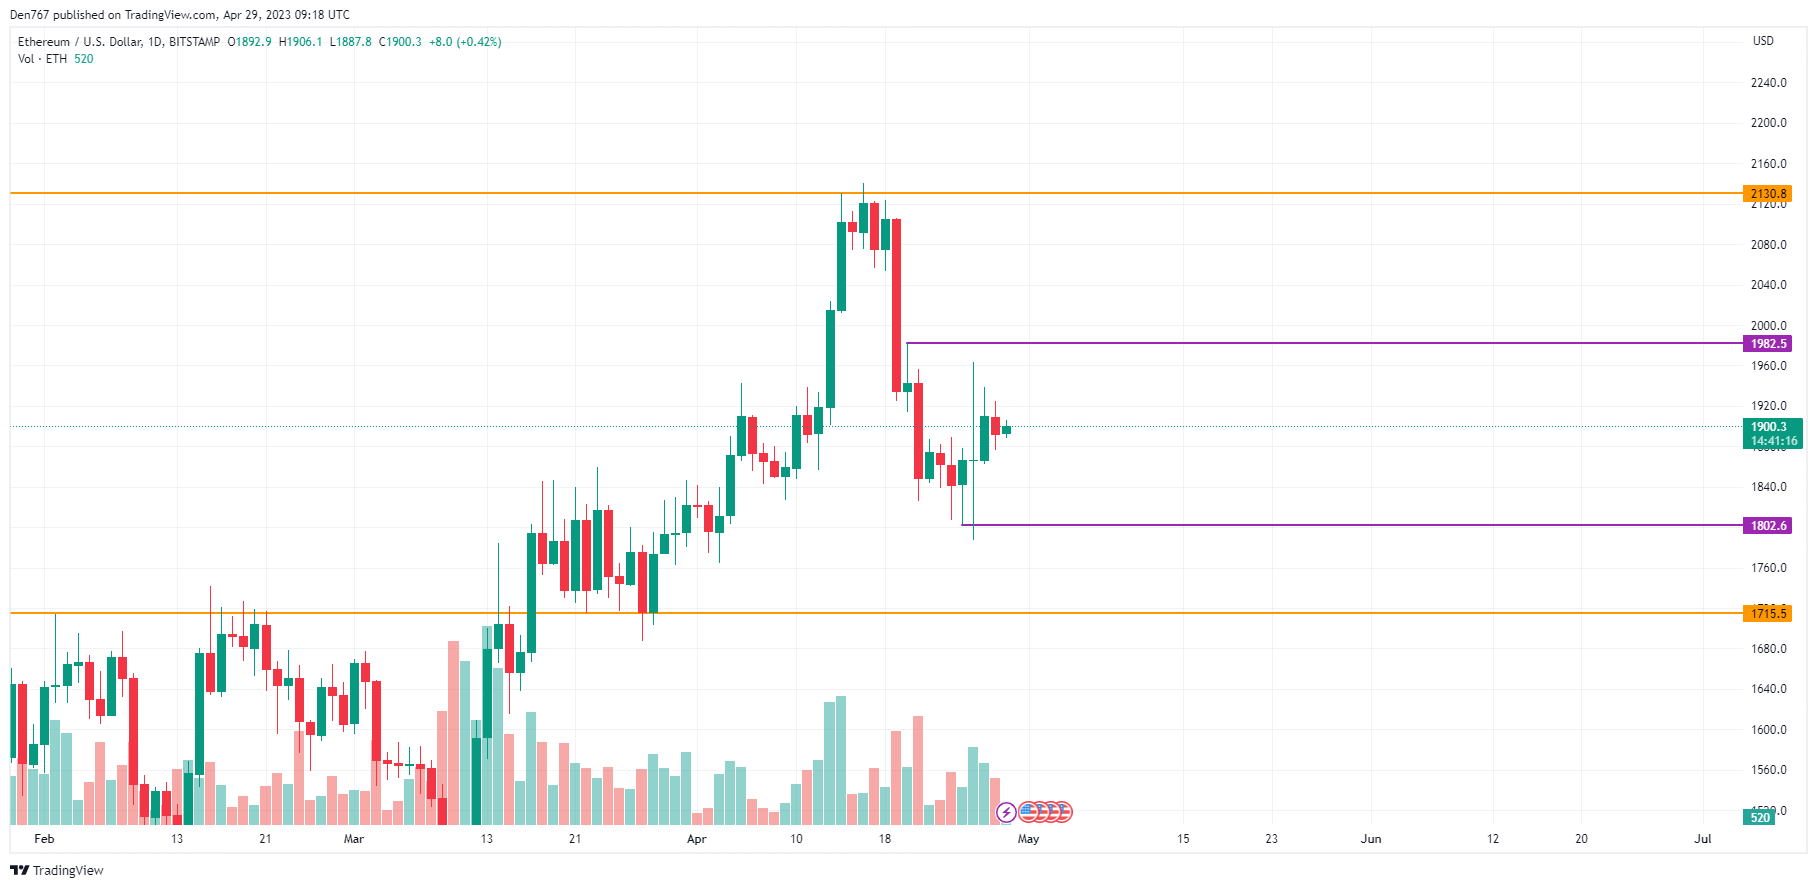
Image by TradingView
On the weekly chart, Ethereum (ETH) is under bearish pressure as the rate is below the important zone of $2,000. Furthermore, traders should pay attention to the nearest support level at $1,715. If the decline continues to it, that might be the start of a midterm bearish trend.
Ethereum is trading at $1,901 at press time.