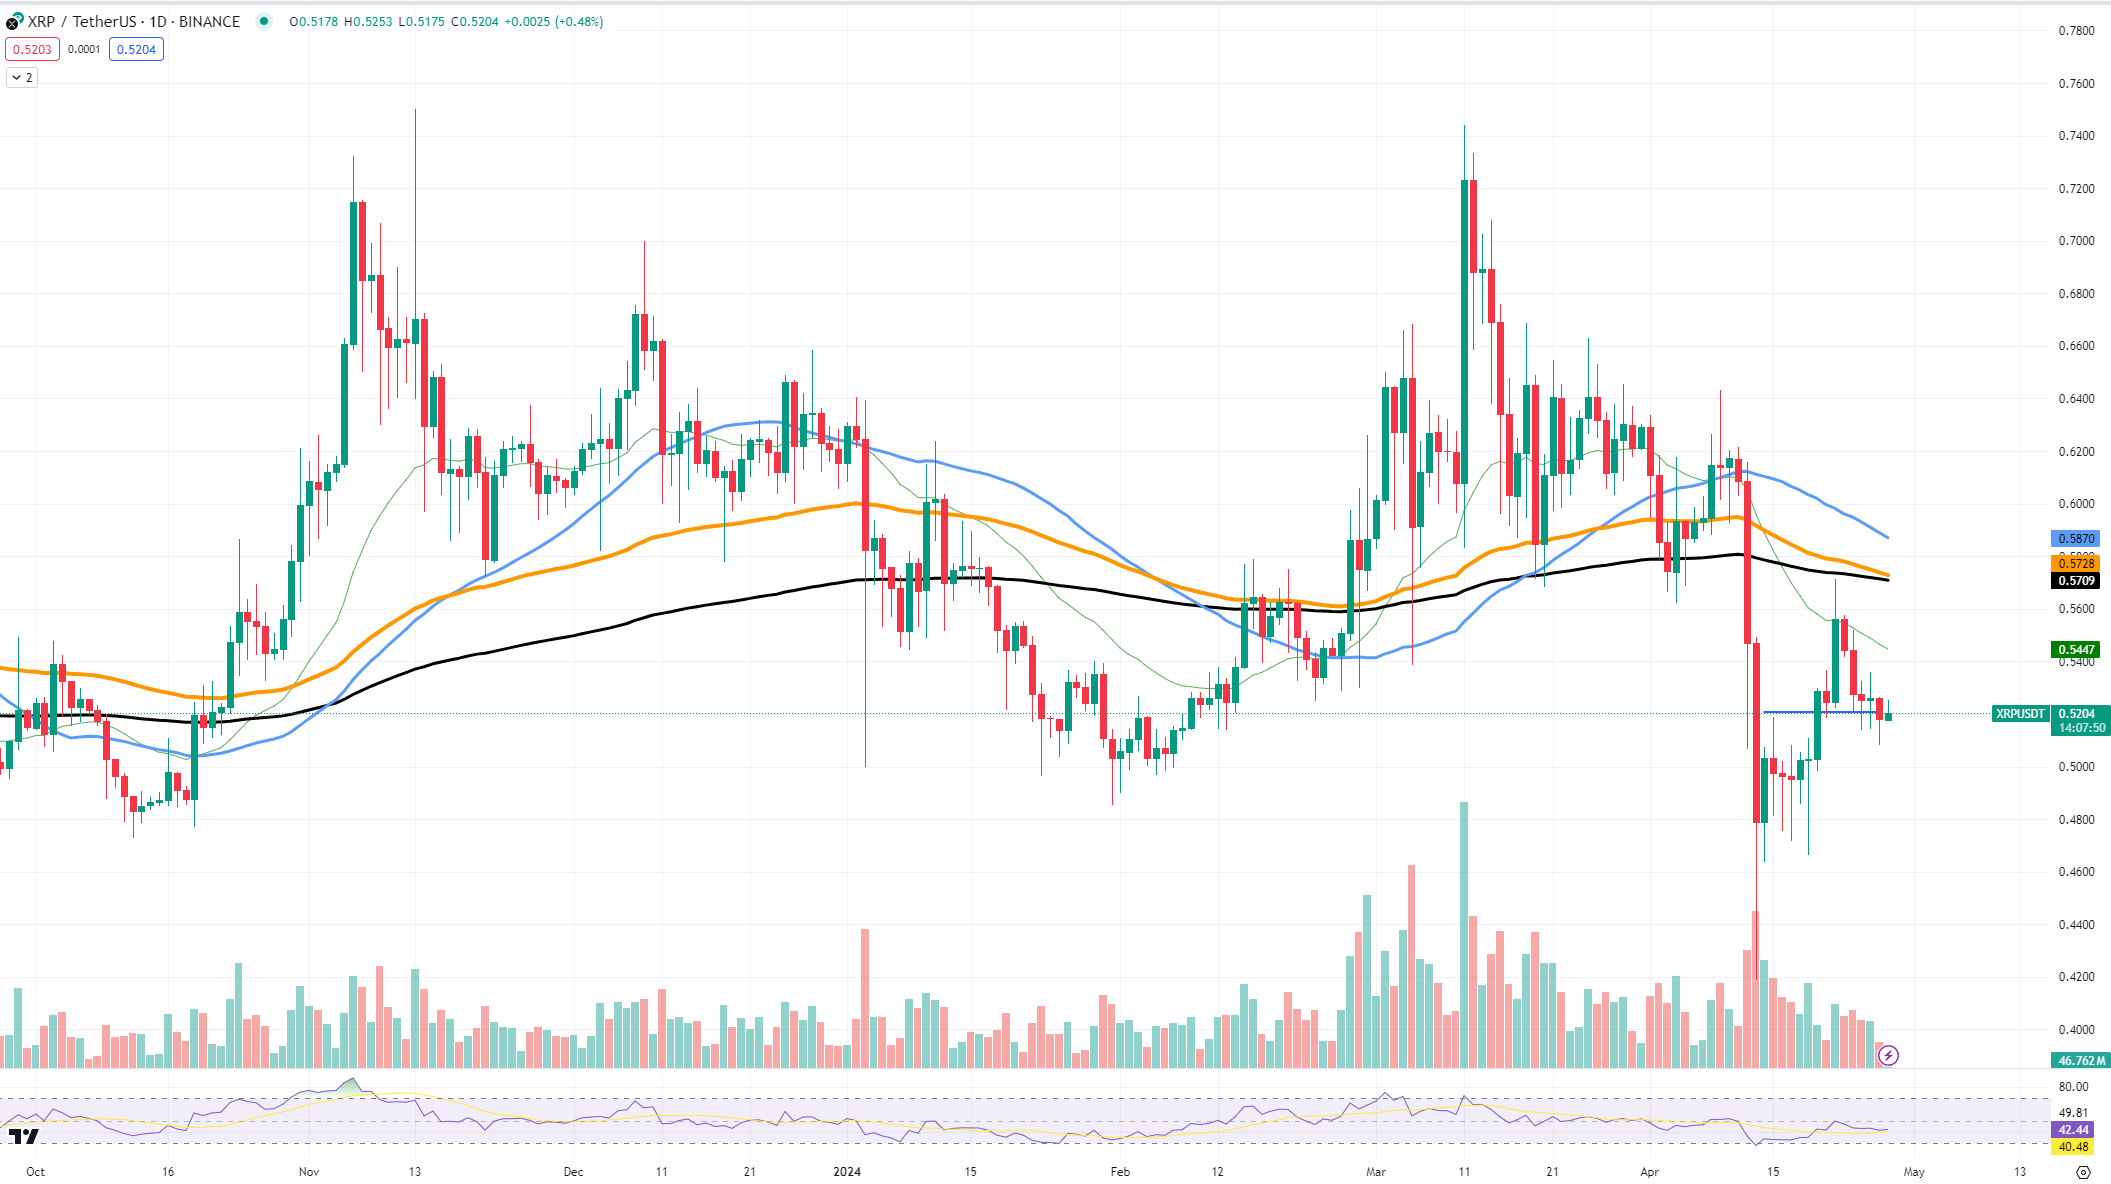
XRP has recently shown a gleam of reversal possibility on XRP chart. Its daily candlestick has turned green, an optimistic sign that could herald a reversal in the short-term market perspective. This change arrives amid descending trading volume, a factor that could inject a note of caution among market watchers.
The current trading volume trend may signal a lack of conviction in the price change or simply a breather before more decisive movements. A critical element to consider in this analysis is the potential crossing of the 100 and 200-day EMA. Such a crossover often implies a significant shift in market momentum, with the shorter-term 100-day EMA moving below the longer-term 200-day EMA, suggesting a bearish outlook.

Looking further ahead, the possibility of a 50 and 200-day EMA cross in the coming months could be an even stronger indicator of a sustained downward trend for XRP. This event would likely confirm a long-term bearish sentiment.
XRP is currently testing a support level near $0.52. If this level holds, we could witness a scenario where XRP attempts to climb towards the immediate resistance level at $0.5728. A successful breach of this threshold could open the path to further gains, potentially aiming for the $0.57 resistance.
However, if the support fails to provide a strong enough floor, XRP could see its value decline toward lower support zones, which may lie around the $0.5000 psychological mark. The green candlestick provides hope for an upward trajectory, but the light trading volume and the looming EMA crosses suggest that it is too early to push longs on XRP and there is a pretty real possibility of an upcoming price reversal that will lead to serious losses.
 u.today