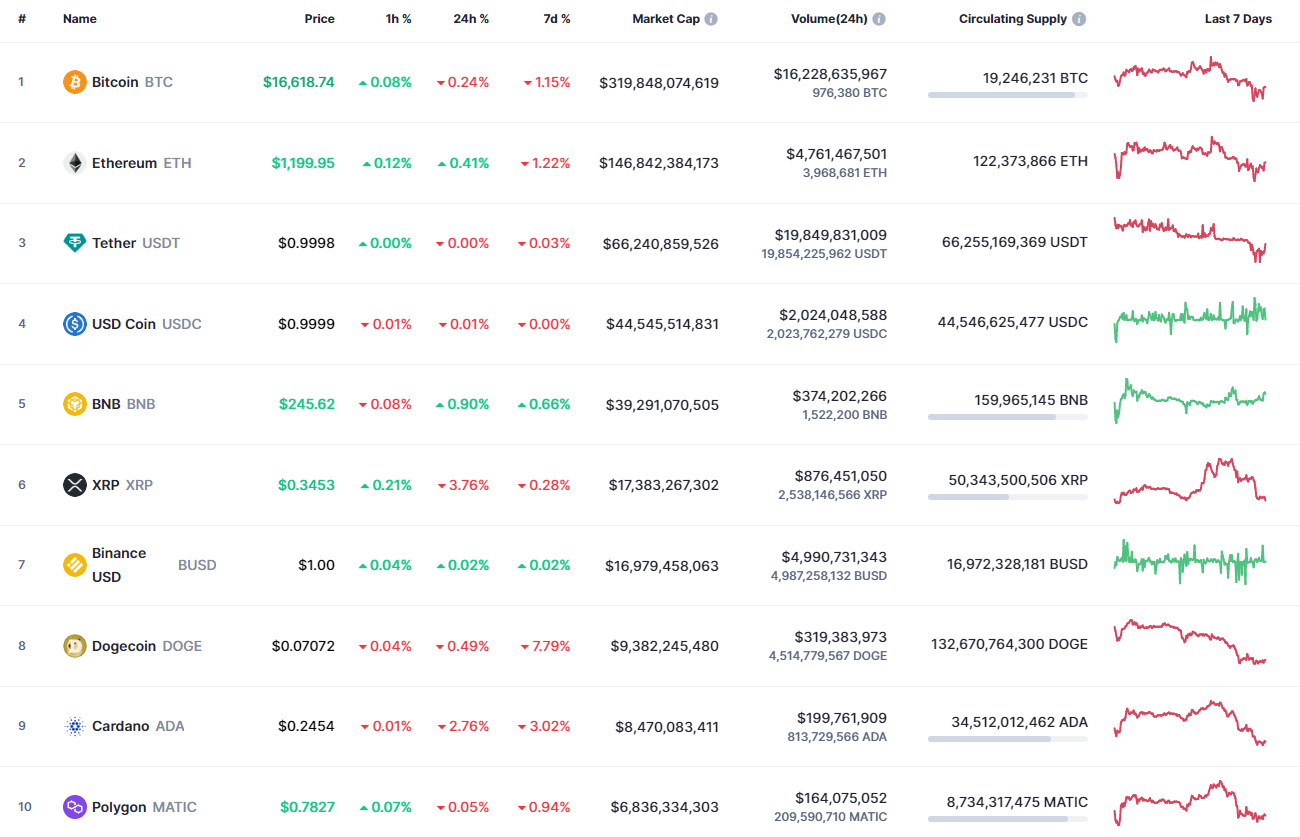
Bears are not going to give up, based on the CoinMarketCap ranking.
BTC/USD
The price of Bitcoin (BTC) has slightly fallen by 0.24% over the last 24 hours.
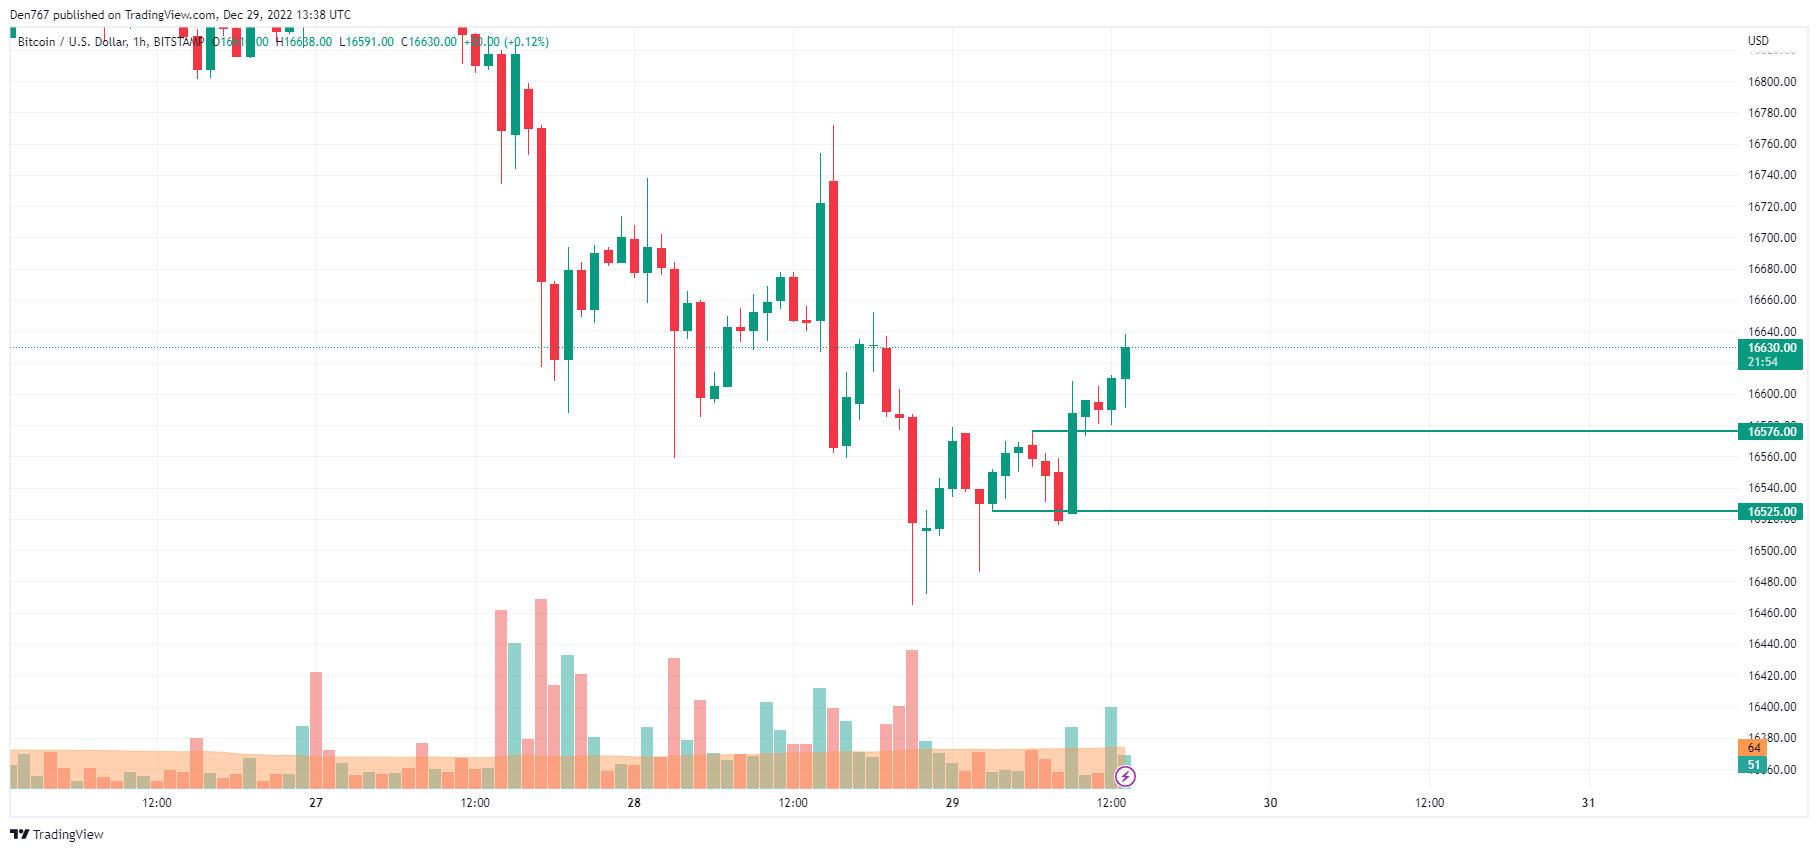
On the hourly chart, the price of Bitcoin (BTC) has broken the resistance at $16,576 against the increased volume, which means that bulls are back in the game.
If the rate can hold above that mark until the end of the day, traders might expect to see the test of the $16,700 zone tomorrow.
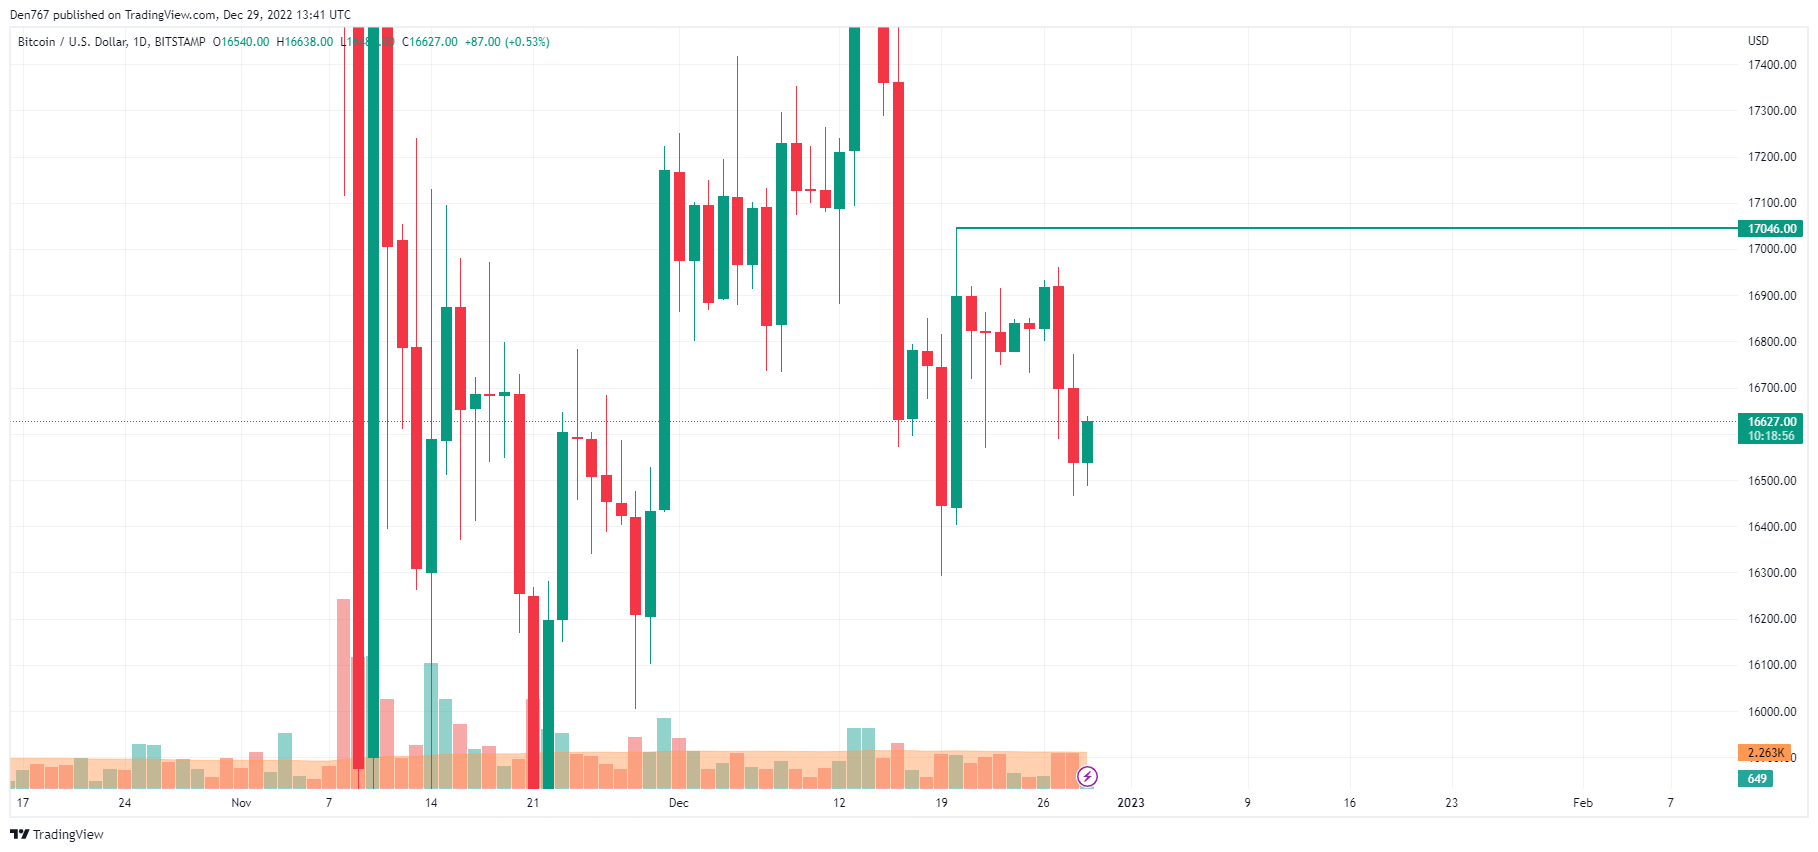
Despite the forming bullish candle on the daily time frame, buyers have not accumulated enough power for continued growth yet. Currently, one should pay attention to the area of $16,800. If the price gets to it and fixes above, the rate of Bitcoin (BTC) might come back to $17,000.
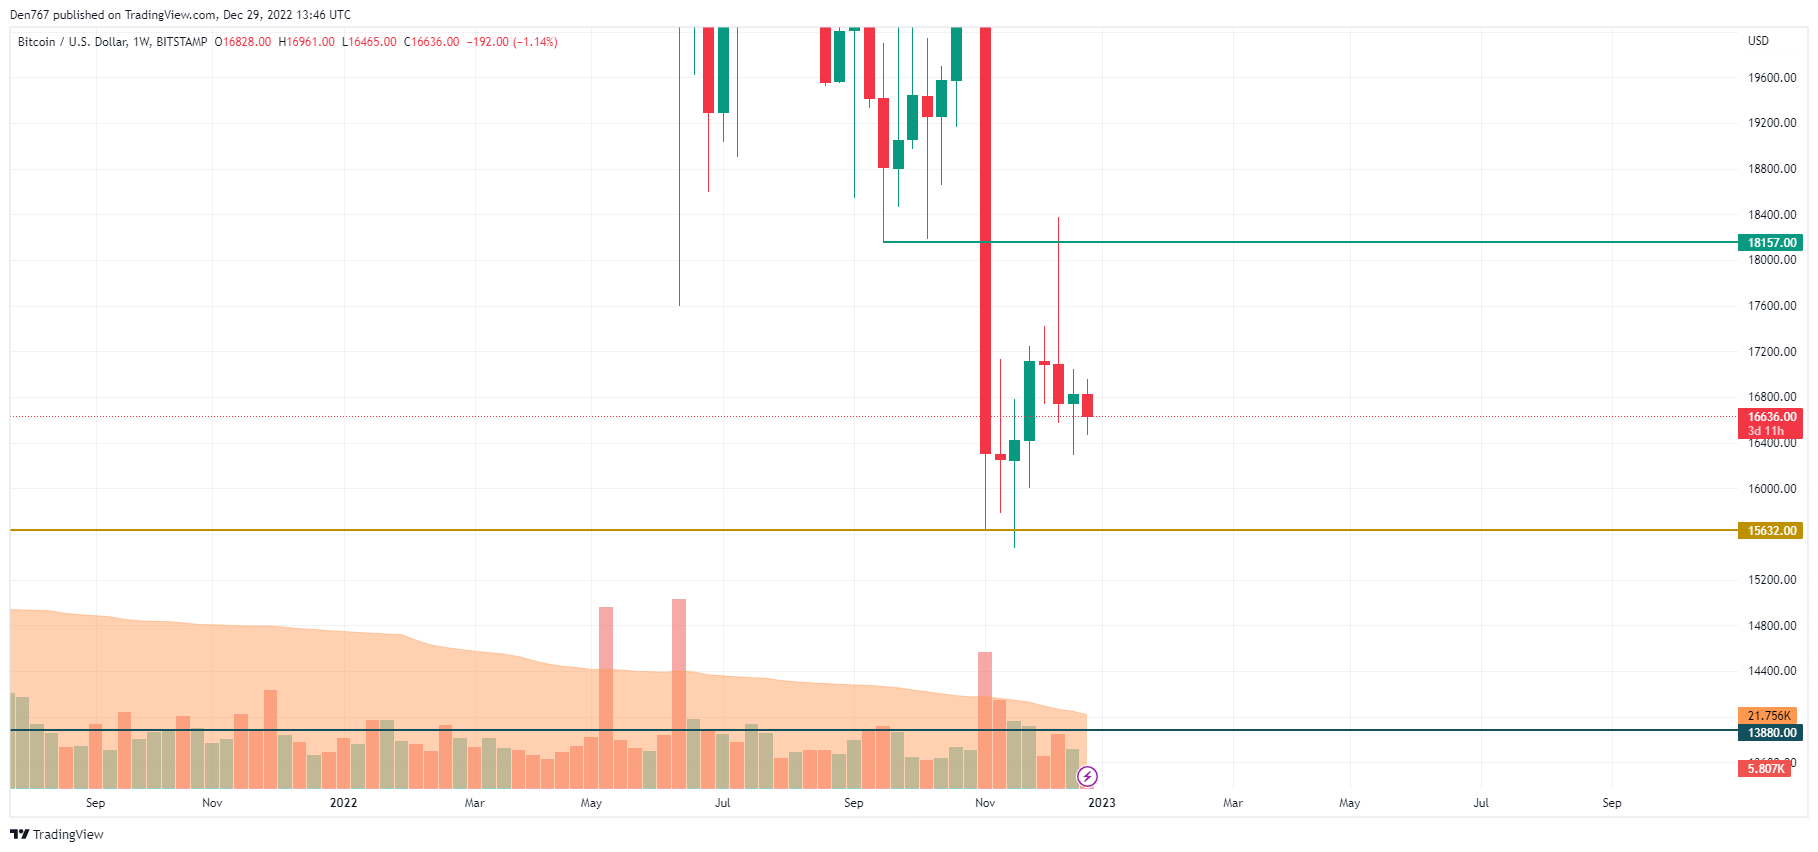
A similar picture can be seen on the weekly chart as the price is far away from the key levels. Sellers are supposed to be more powerful than bulls to a certain extent, as the rate is located close to the $16,400 zone. If the breakout of it happens, there is a high possibility of seeing the test of the $16,000 mark soon.
Bitcoin is trading at $16,636 at press time.