Today’s market session has seen bulls and bears fight for dominance as seen from the slight movements in the global market cap. The total cap stood at $2.38T as of press time, representing a 0.89% increase over the last 24 hours.
Bitcoin Price Review
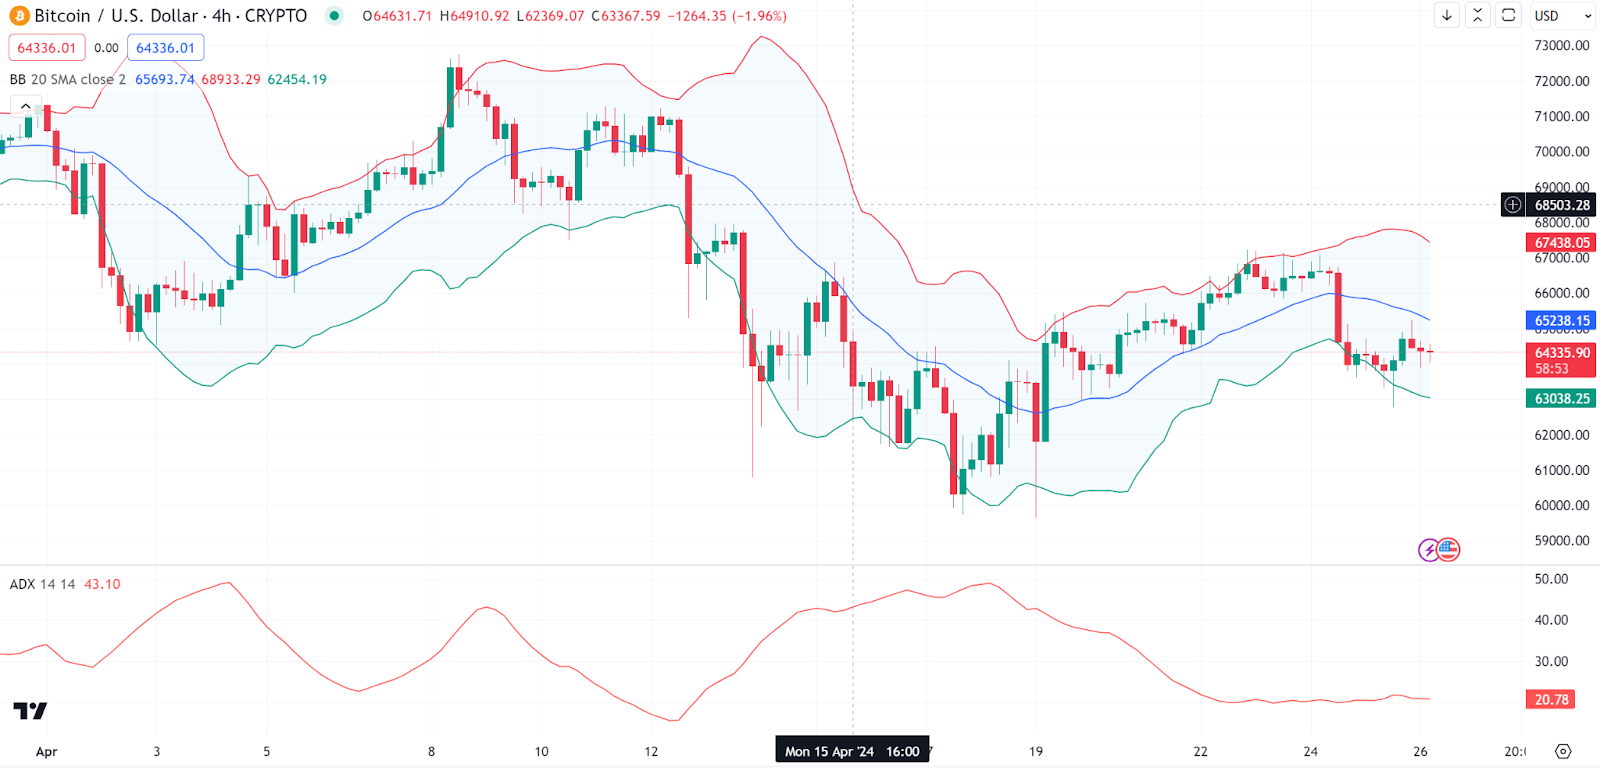
Bitcoin (BTC) is facing consolidations in today’s session as evidenced by its minimal price movements. Bitcoin price chart indicates a trend within a Bollinger Bands (BB) envelope, with the price recently having moved below the middle BB (20 SMA). This may suggest a bearish trend as the price is below the upper band.
On the other hand, the Average Directional Index (ADX) is above 25, which typically indicates a strong trend; however, the declining slope suggests the trend may be losing some strength. As of press time, the Bitcoin price stood at $64,303, representing a 0.01% increase from its previous 24-hour price.
Ethereum Price Review
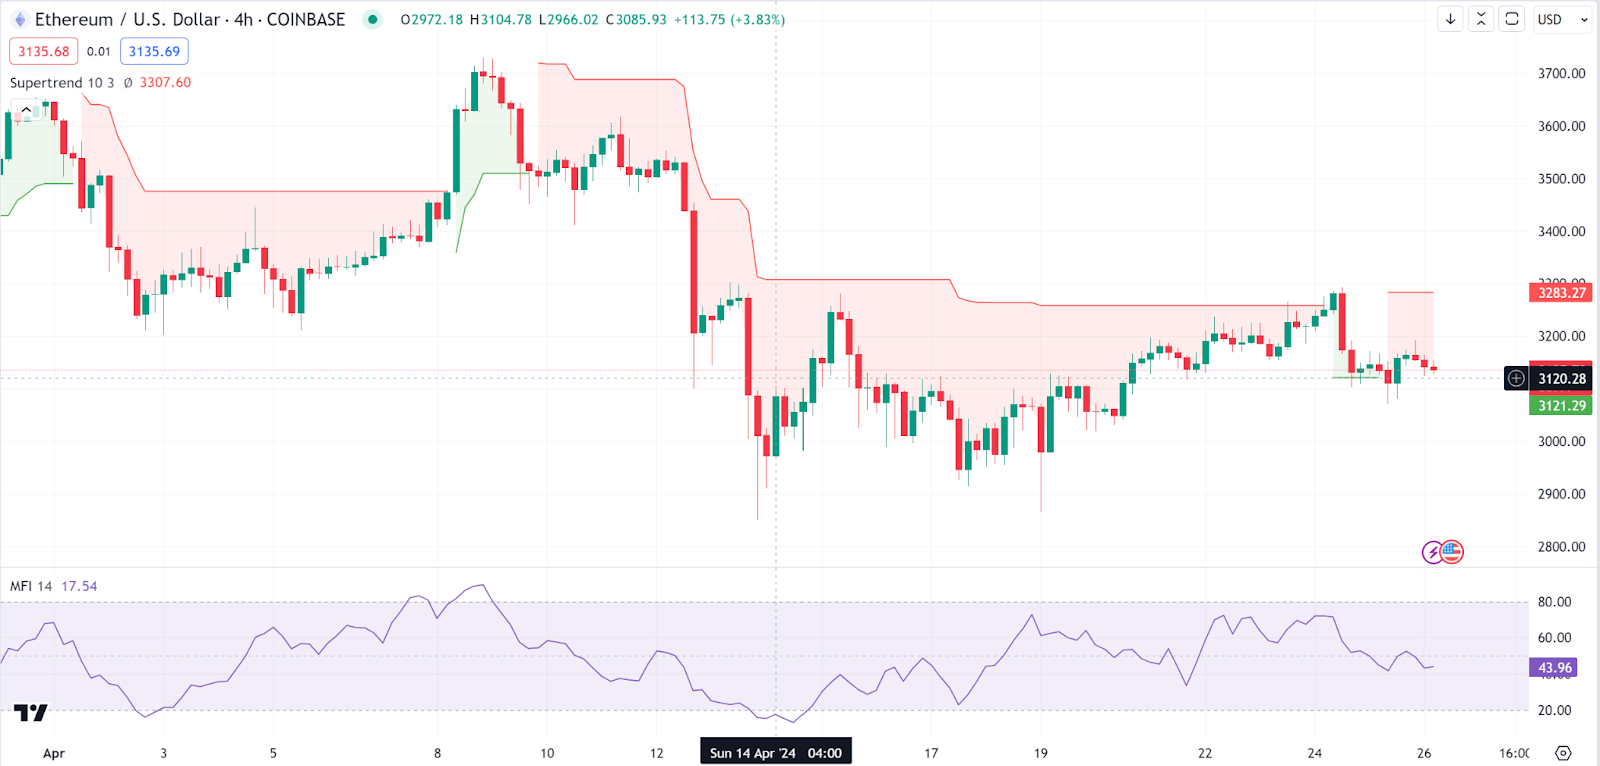
Ethereum (ETH) is also in a consolidation phase, as evidenced by its price movements during today’s session. The Ethereum price movement shows a trading pattern within the confines of a Super Trend indicator, which is currently in a bearish phase, as indicated by the red shading above the price bars.
On the other hand, the Money Flow Index (MFI) is quite low, around 17.54, suggesting that there could be an oversold condition. Generally, if the MFI is below 20, it may indicate that the asset is oversold and potentially due for a reversal or bounce. As of press time, the Ethereum price stood at $3,312 representing a 0.03% increase from its previous 24-hour price.
Wormhole Price Review
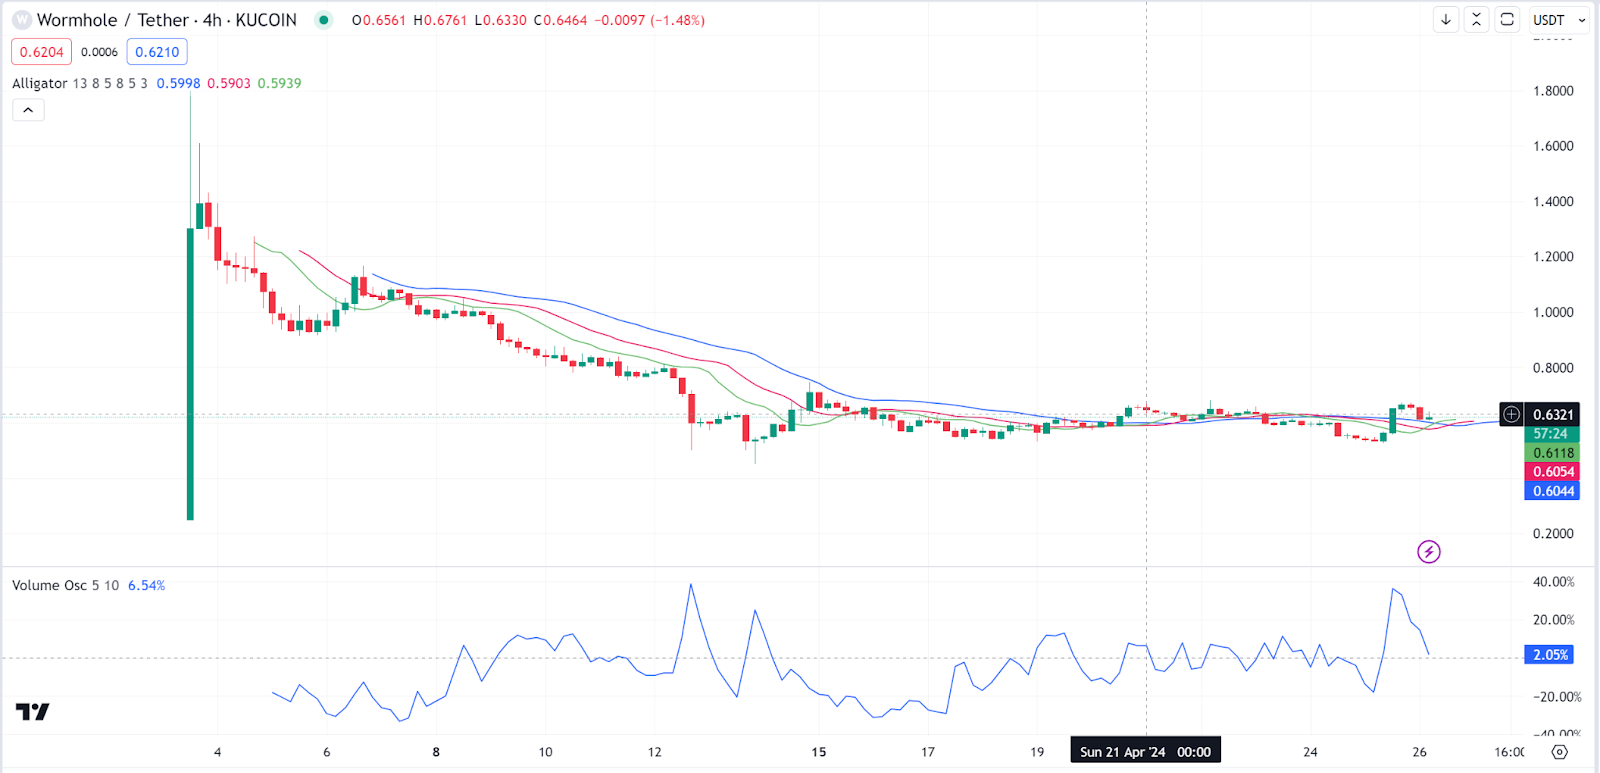
Wormhole (W) is today’s top gainer, as evidenced by its impressive price movements. Wormhole price charts show a consistent downtrend indicated by the Alligator indicator, where the price is below the Alligator’s lips, teeth, and jaw, confirming a bearish market.
Conversely, looking at other indicators, we see the Volume Oscillator is positive, suggesting increased buying volume, but it may not be sufficient to reverse the trend at this stage. As of press time, the Wormhole price stood at $0.617, representing a 14.4% increase from its previous 24-hour price.
Theta Fuel Price Review
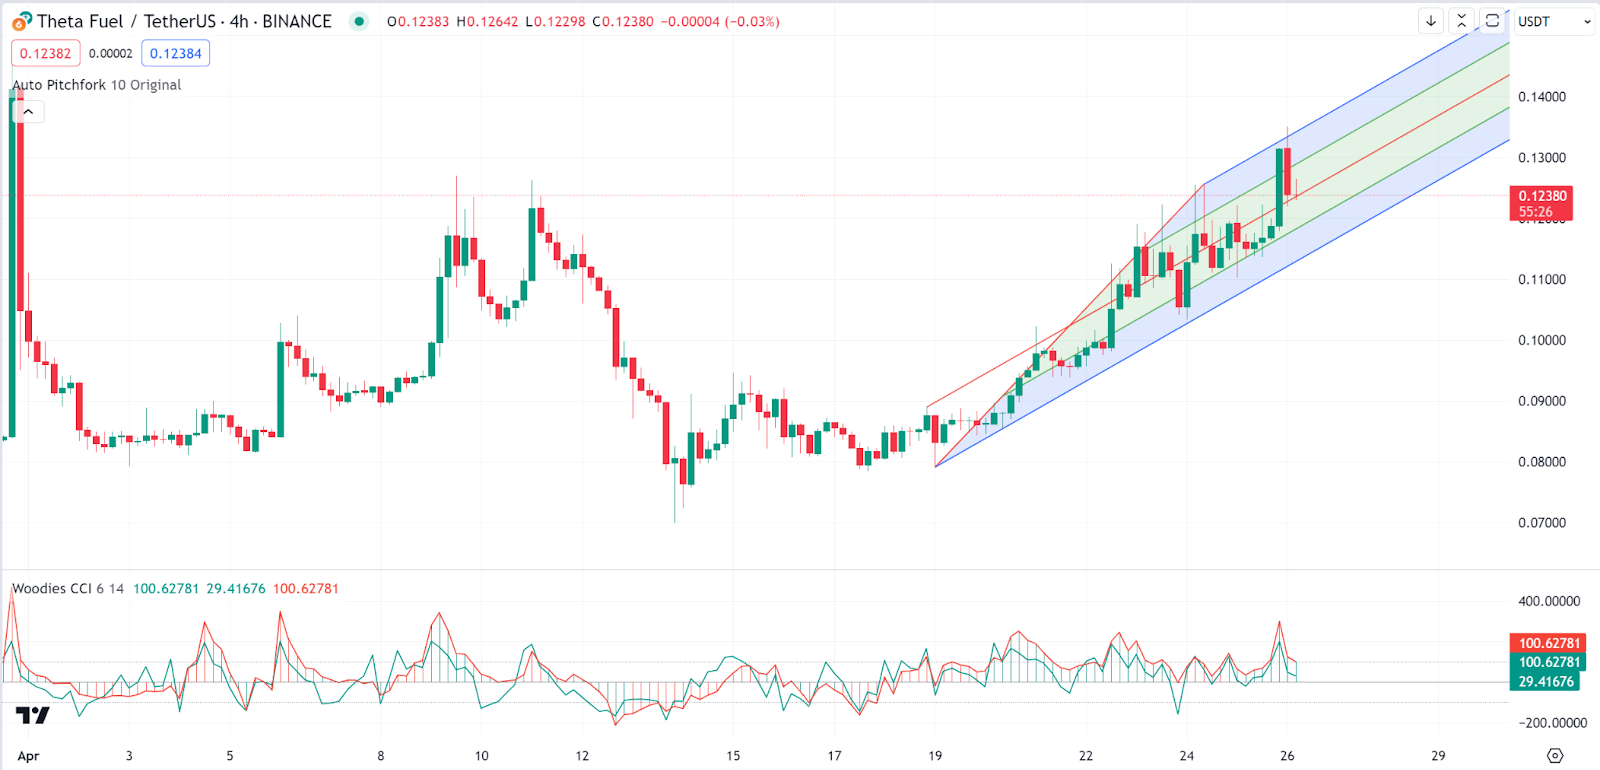
Theta Fuel (TFUEL) is another top gainer in today’s session, as seen from its price movements. An in-depth analysis of Theta Fuel price charts shows that it is exhibiting a rising price channel. The Auto Pitchfork indicator shows the median line occasionally acting as support.
On the other hand, the Commodity Channel Index (CCI) is close to 100, indicating that the price is moving towards overbought territory and could be due for a correction or consolidation. As of press time, the Theta Fuel price stood at $0.1235, representing a 6% increase from its previous 24-hour price.
Near Protocol Price Review
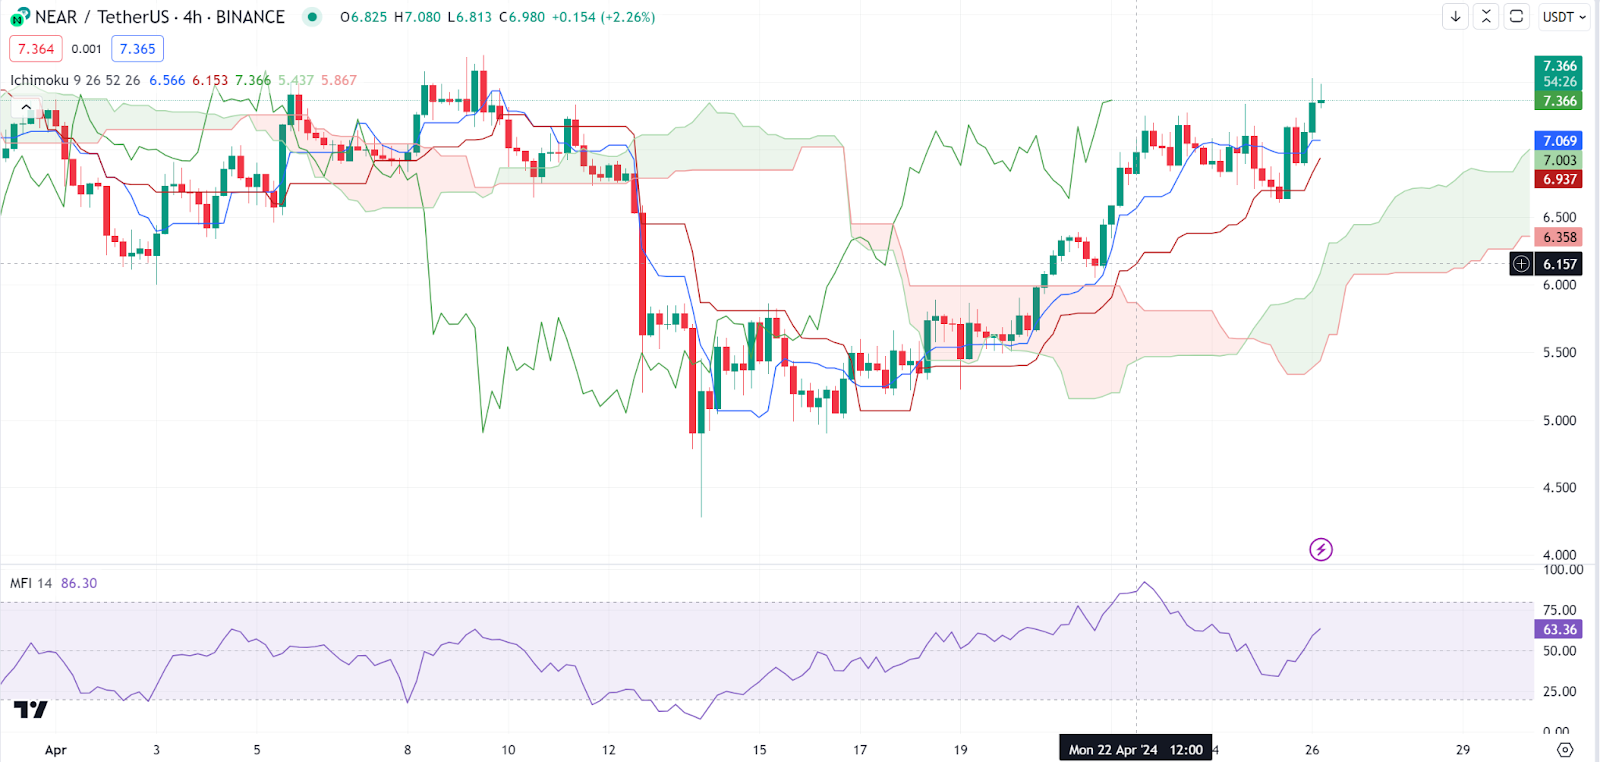
As its performance shows, Near Protocol (NEAR) was another top gainer in today’s session. Taking a minute to analyse Near Protocol price charts, we see that the Ichimoku Cloud is currently green, and the price is above the cloud, which is a bullish signal. The Near Protocol price is also above the Base Line (red) and the Conversion Line (blue), reinforcing the bullish outlook.
Conversely, looking at extra indicators, we see that the Money Flow Index (MFI) is high, near 86, indicating that the asset might be overbought, which can sometimes precede a pullback. As of press time, the Near Protocol price stood at $7.35, representing a 7.4% increase from its previous 24-hour price.