Compound is a Defi application that uses a lending protocol. This protocol helps users in earning interest on depositing their cryptocurrencies into several pools provided by the platform. When their users deposit tokens into the pools, in return, COMP provides cTokens. These cTokens determine an individual’s share in the compounded pool. And, also cTokens are used to redeem the underlying cryptocurrency. Let us look at the technical analysis of COMP.
Past Performance of Compound
On September 16, 2021, COMP opened at $443.79. On September 23, 2021, COMP closed at $373.15. Thus, in the past week, the COMP price has decreased approximately by 15%. In the last 24 hours, COMP has traded between $375.20-$337.84.
https://www.tradingview.com/x/dCdH3Wzv/
COMP Technical Analysis
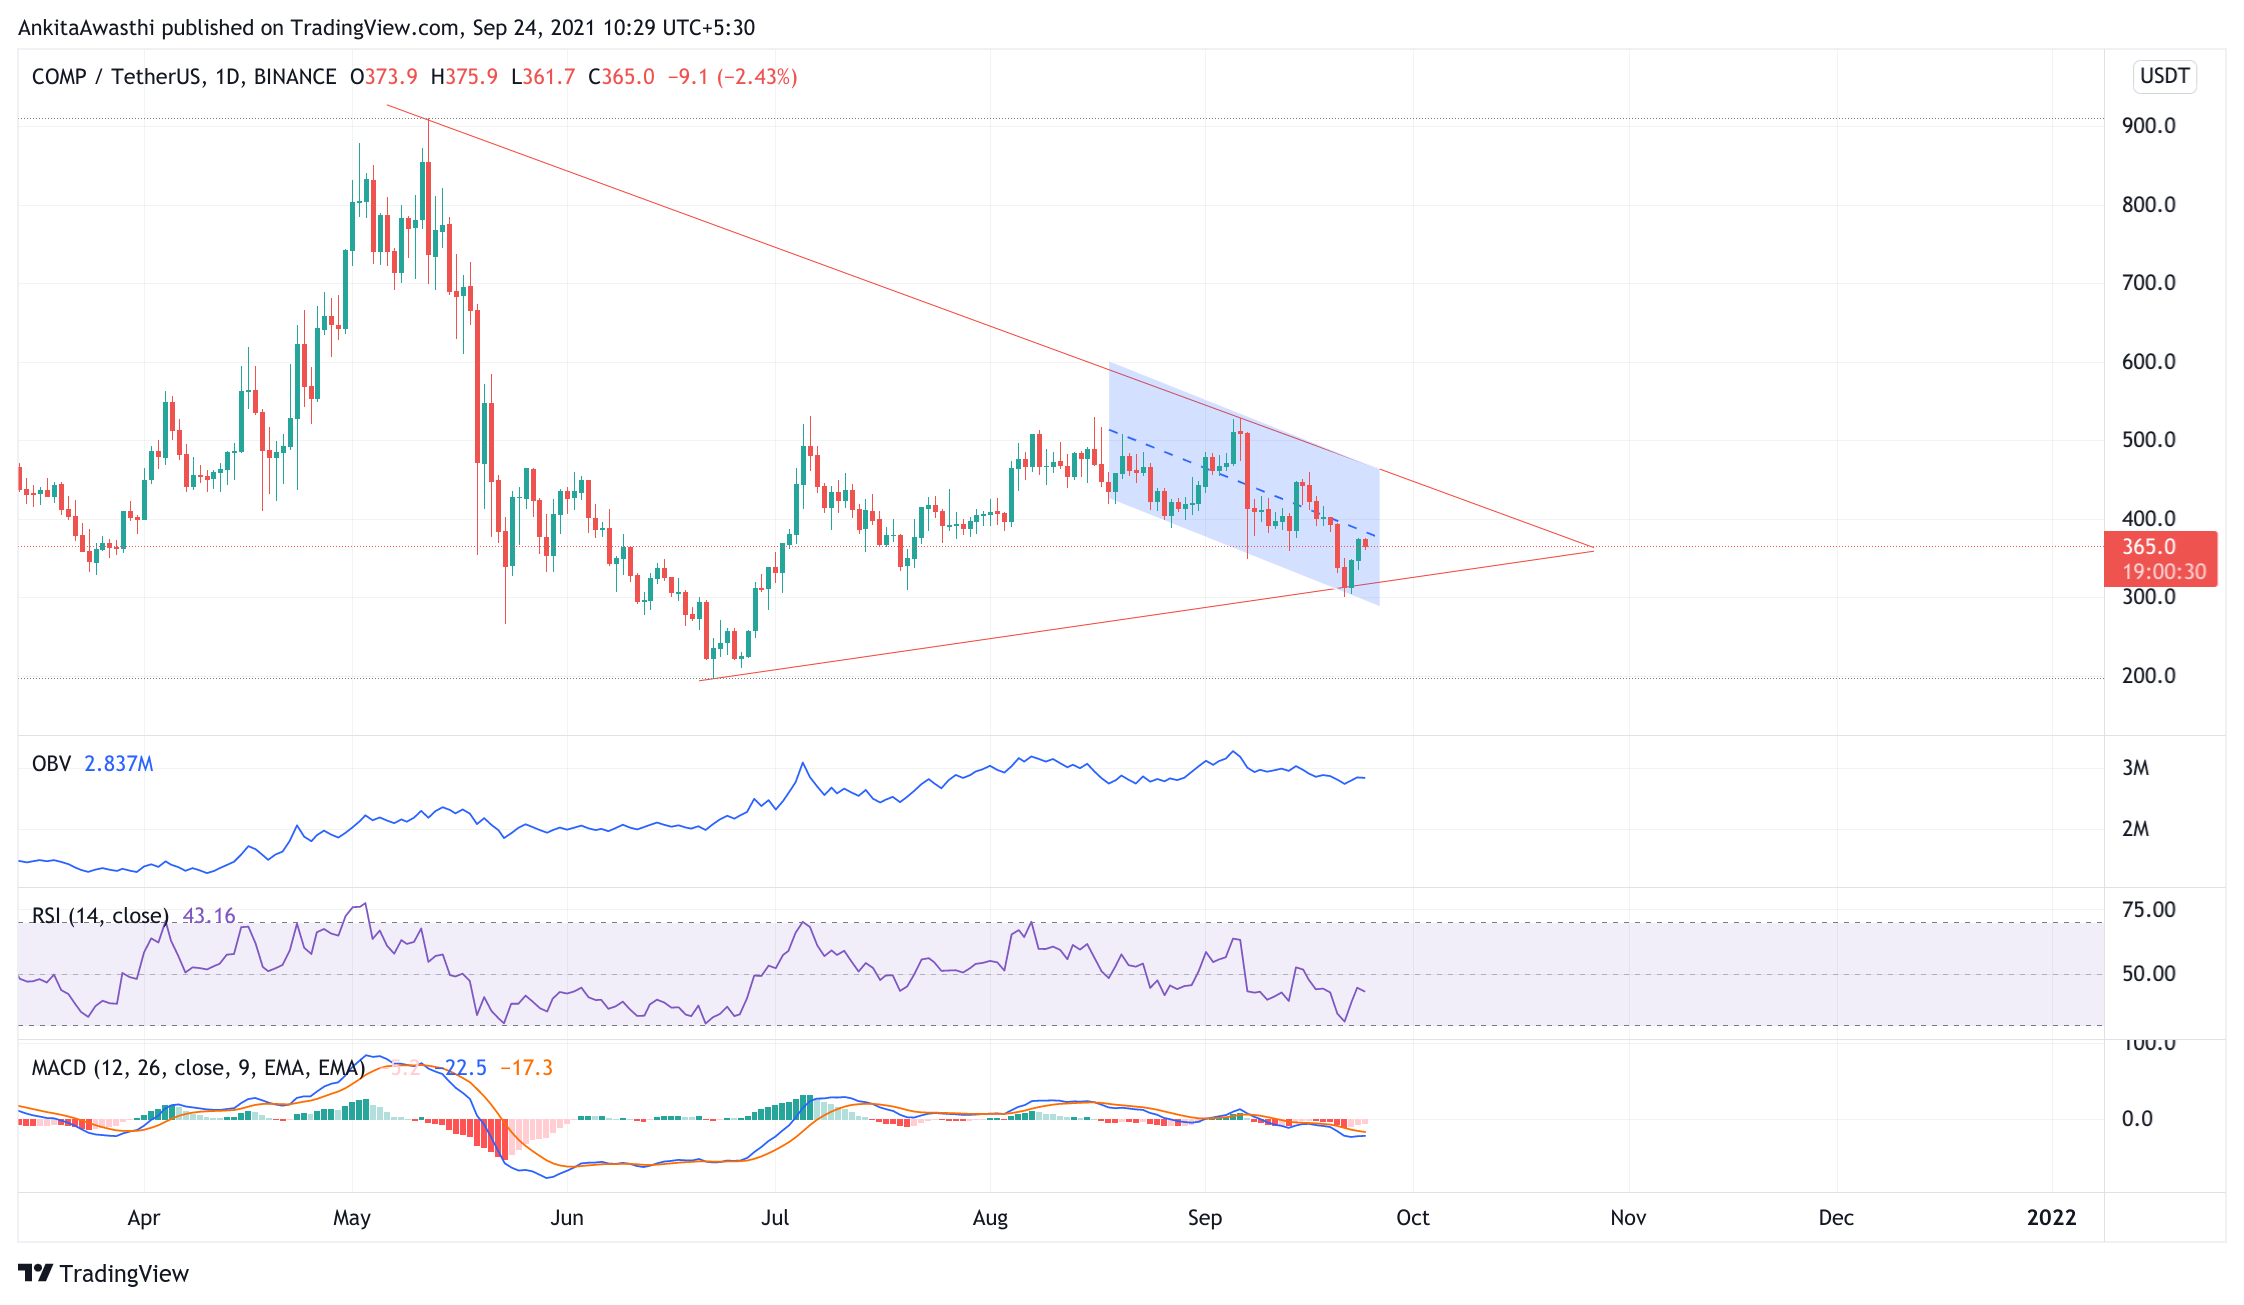
Due to the market recovery and the fall in DXY index, altcoins have jumped in the last 24 hours. It seems that they are back on track. COMP after taking support from the bottom of the parallel channel is near to its resistance level. However, we can see some profit booking in the entire crypto market. Let us see what the indicators are saying:
At the time of writing, COMP is trading at $365.30. The price is down by 3.4% (approximately) from the opening price, and forming a bearish candle for the day. Thus, indicating high selling pressure in the market.
However, COMP is forming a really narrow range on the daily chart, a breakout on either side will give us a better outlook. We have to closely watch the demand zone (current level) and see if the price tests and breaks the long-term support level or not. If the price breaks and sustains below the resistance level of $376, we might see the trend changing.
On the daily chart, the MACD and signal are in the negative zone. Moreover, we can see a bearish crossover by the MACD line over the Signal line. Thus, the overall market momentum seems bearish, and we can expect a price to fall for a day or so.
The RSI on the daily chart is resisting from the 44% mark. A bounce from this level is highly possible. Moreover, it has been forming a bearish divergence. Therefore, the price is expected to fall.
Day-Ahead and Tomorrow
COMP is trading below the Fibonacci pivot resistance level of $381.14, which has acted as a strong support level. We can expect the price to hold at this pivot level, however, if the selling pressure remains the same, the price might break down from the level and fall. Here, an opportunity for a short position arises.
Traders can enter into the long trade, once the price breaks $375.13, by keeping the target of $381.68 and stop-loss at $360.10.