It appears that Ethereum failed at yet another attempt to convincingly overcome $1,700, showing that the buying pressure is slowly fading. The question is if the momentum will pick up or if the bears will take the opportunity to bring the price lower.
Technical Analysis
By Grizzly
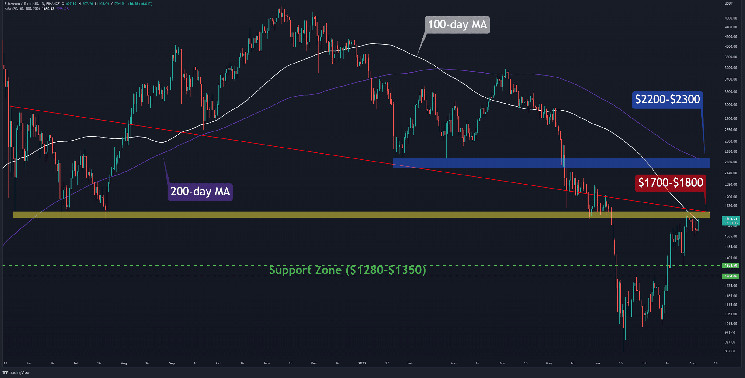
The Daily Chart
The daily chart shows that the firm resistance in the $1,700-$1,800 range is far from over. This resistance zone, which includes the 100-day moving average (in white), is considered the main obstacle for bulls on the way to $2000. A break and close above it would signal the start of a new uptrend with a target of $2,200 (in blue), which overlaps with the 200-day moving average (in purple).
Countering this assumption, if the demand in this area dries up and the bears dominate the market again, the possible decline can extend to the support zone in the range of $1,280-1,350 (in green).
Currently, the structure has not changed, and until the lower highs and lower lows are formed, the bullish sentiment prevails.
Key Support Levels: $1500 & $1350
Key Resistance Levels: $1800 & $2200
Daily Moving Averages
MA20: $1589
MA50: $1323
MA100: $1681
MA200: $2294
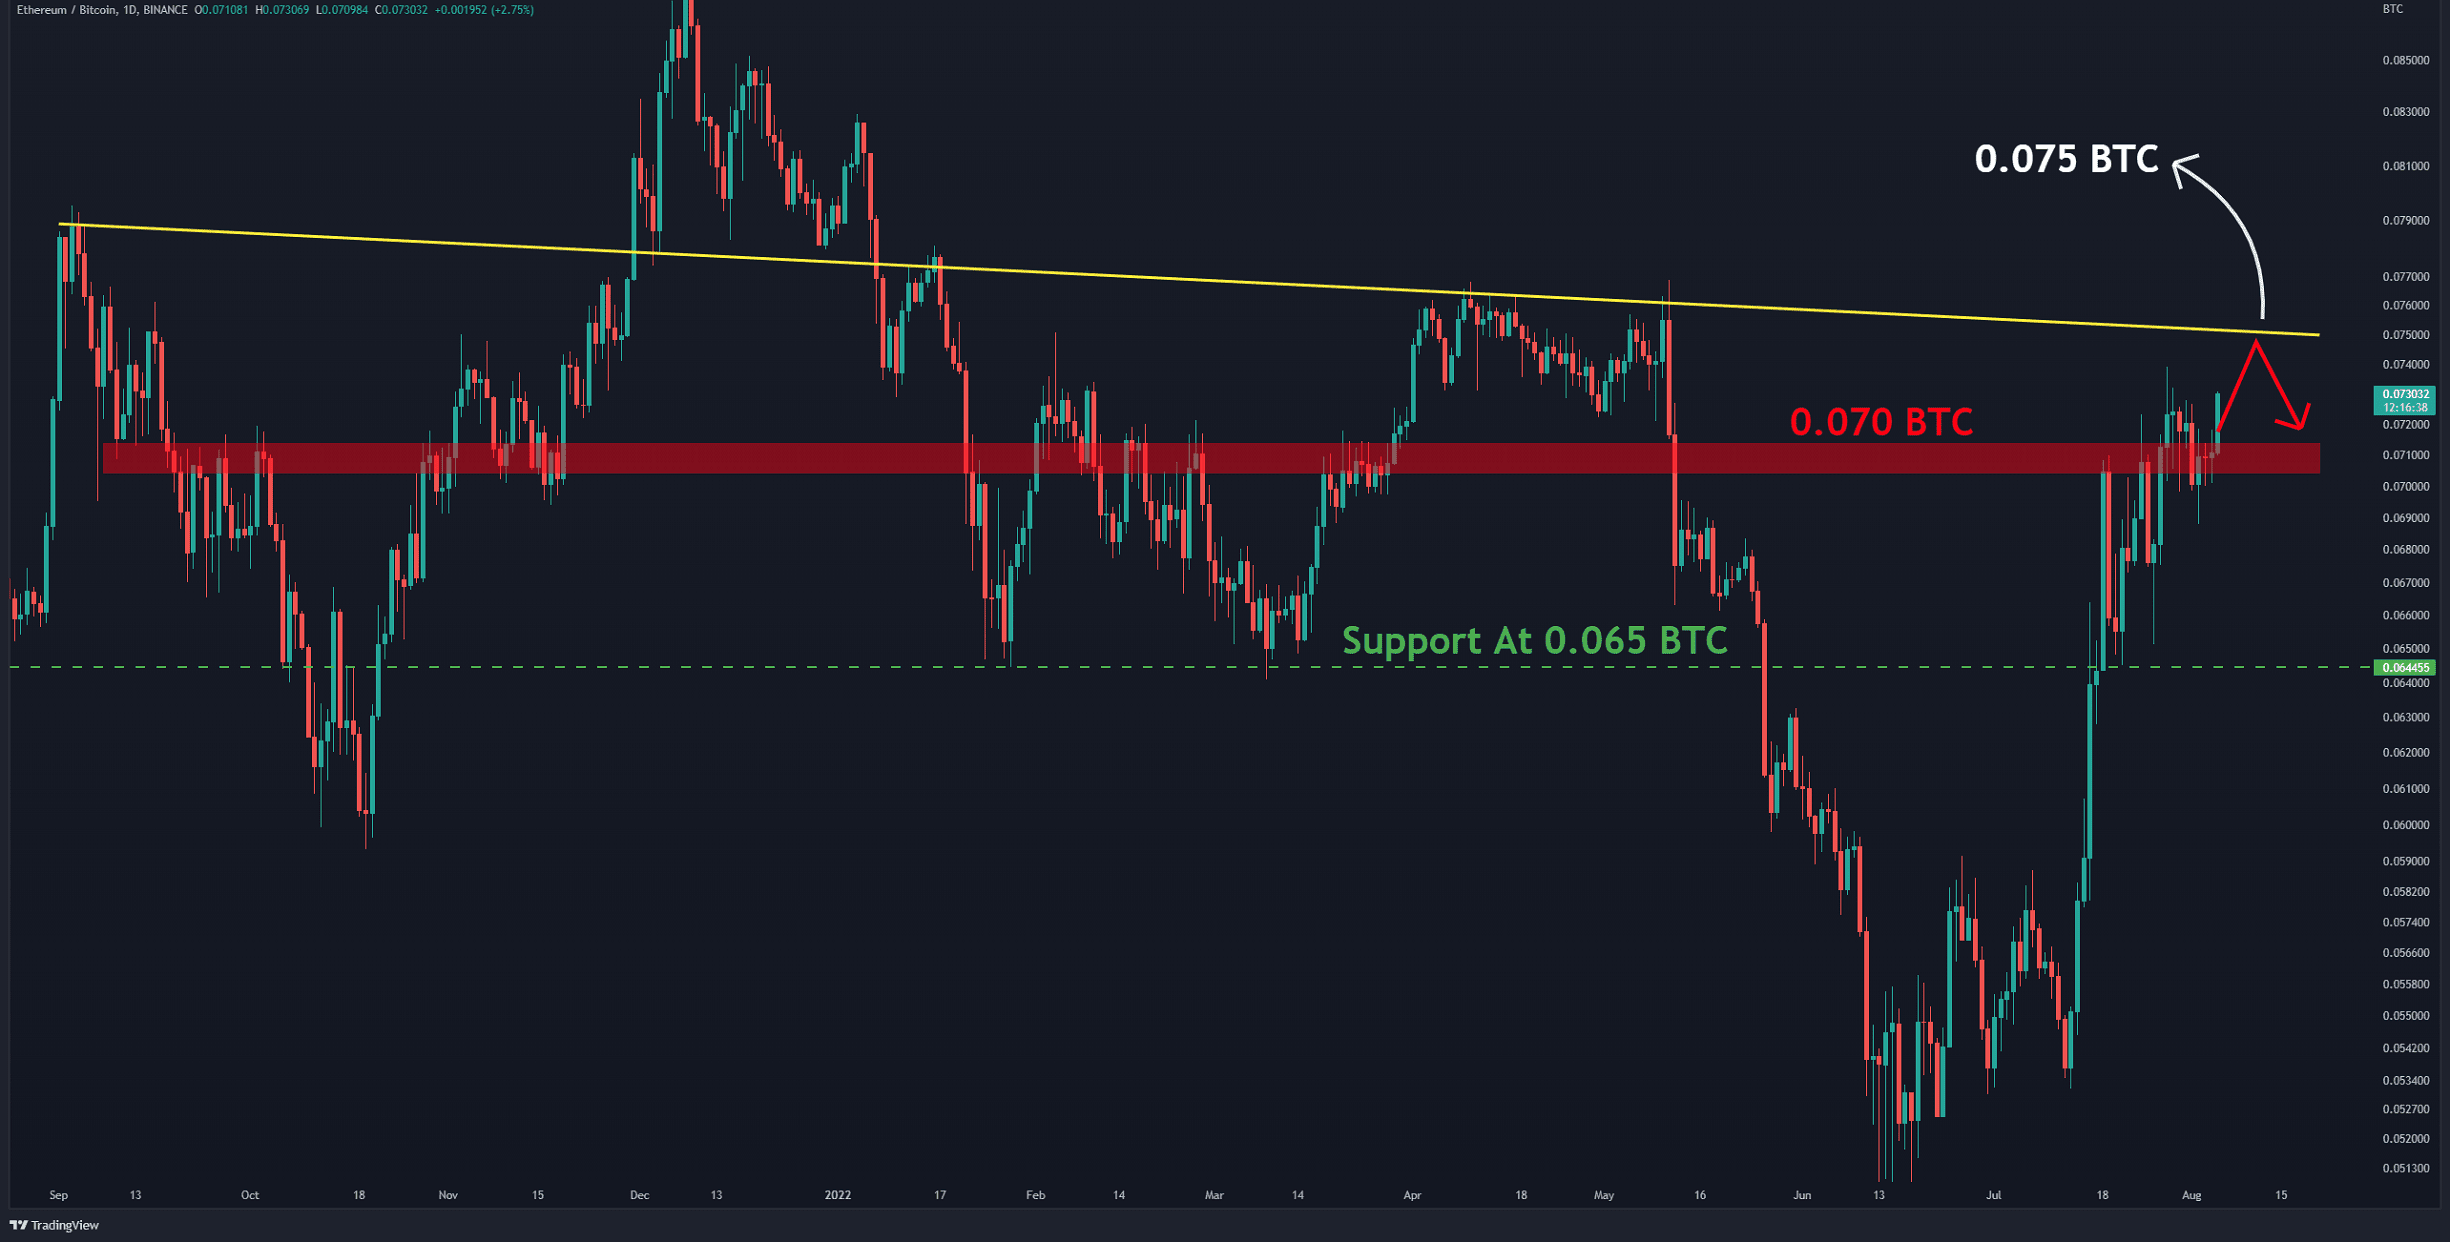
The ETH/BTC Chart
Against Bitcoin, the buyers dominate the market completely. All corrective attempts on the lower time frames are absorbed quickly. The bulls are trying to sustain the price above 0.07 BTC (in red). At this point, it seems more likely that the resistance at 0.75 BTC will be tested. This is where the bears might stage a reappearance. The bullish trend would remain strong as long as ETH is trading above horizontal support at 0.065 BTC (in green).
Key Support Levels: 0.065 & 0.06 BTC
Key Resistance Levels: 0.073 & 0.075 BTC
Sentiment Analysis
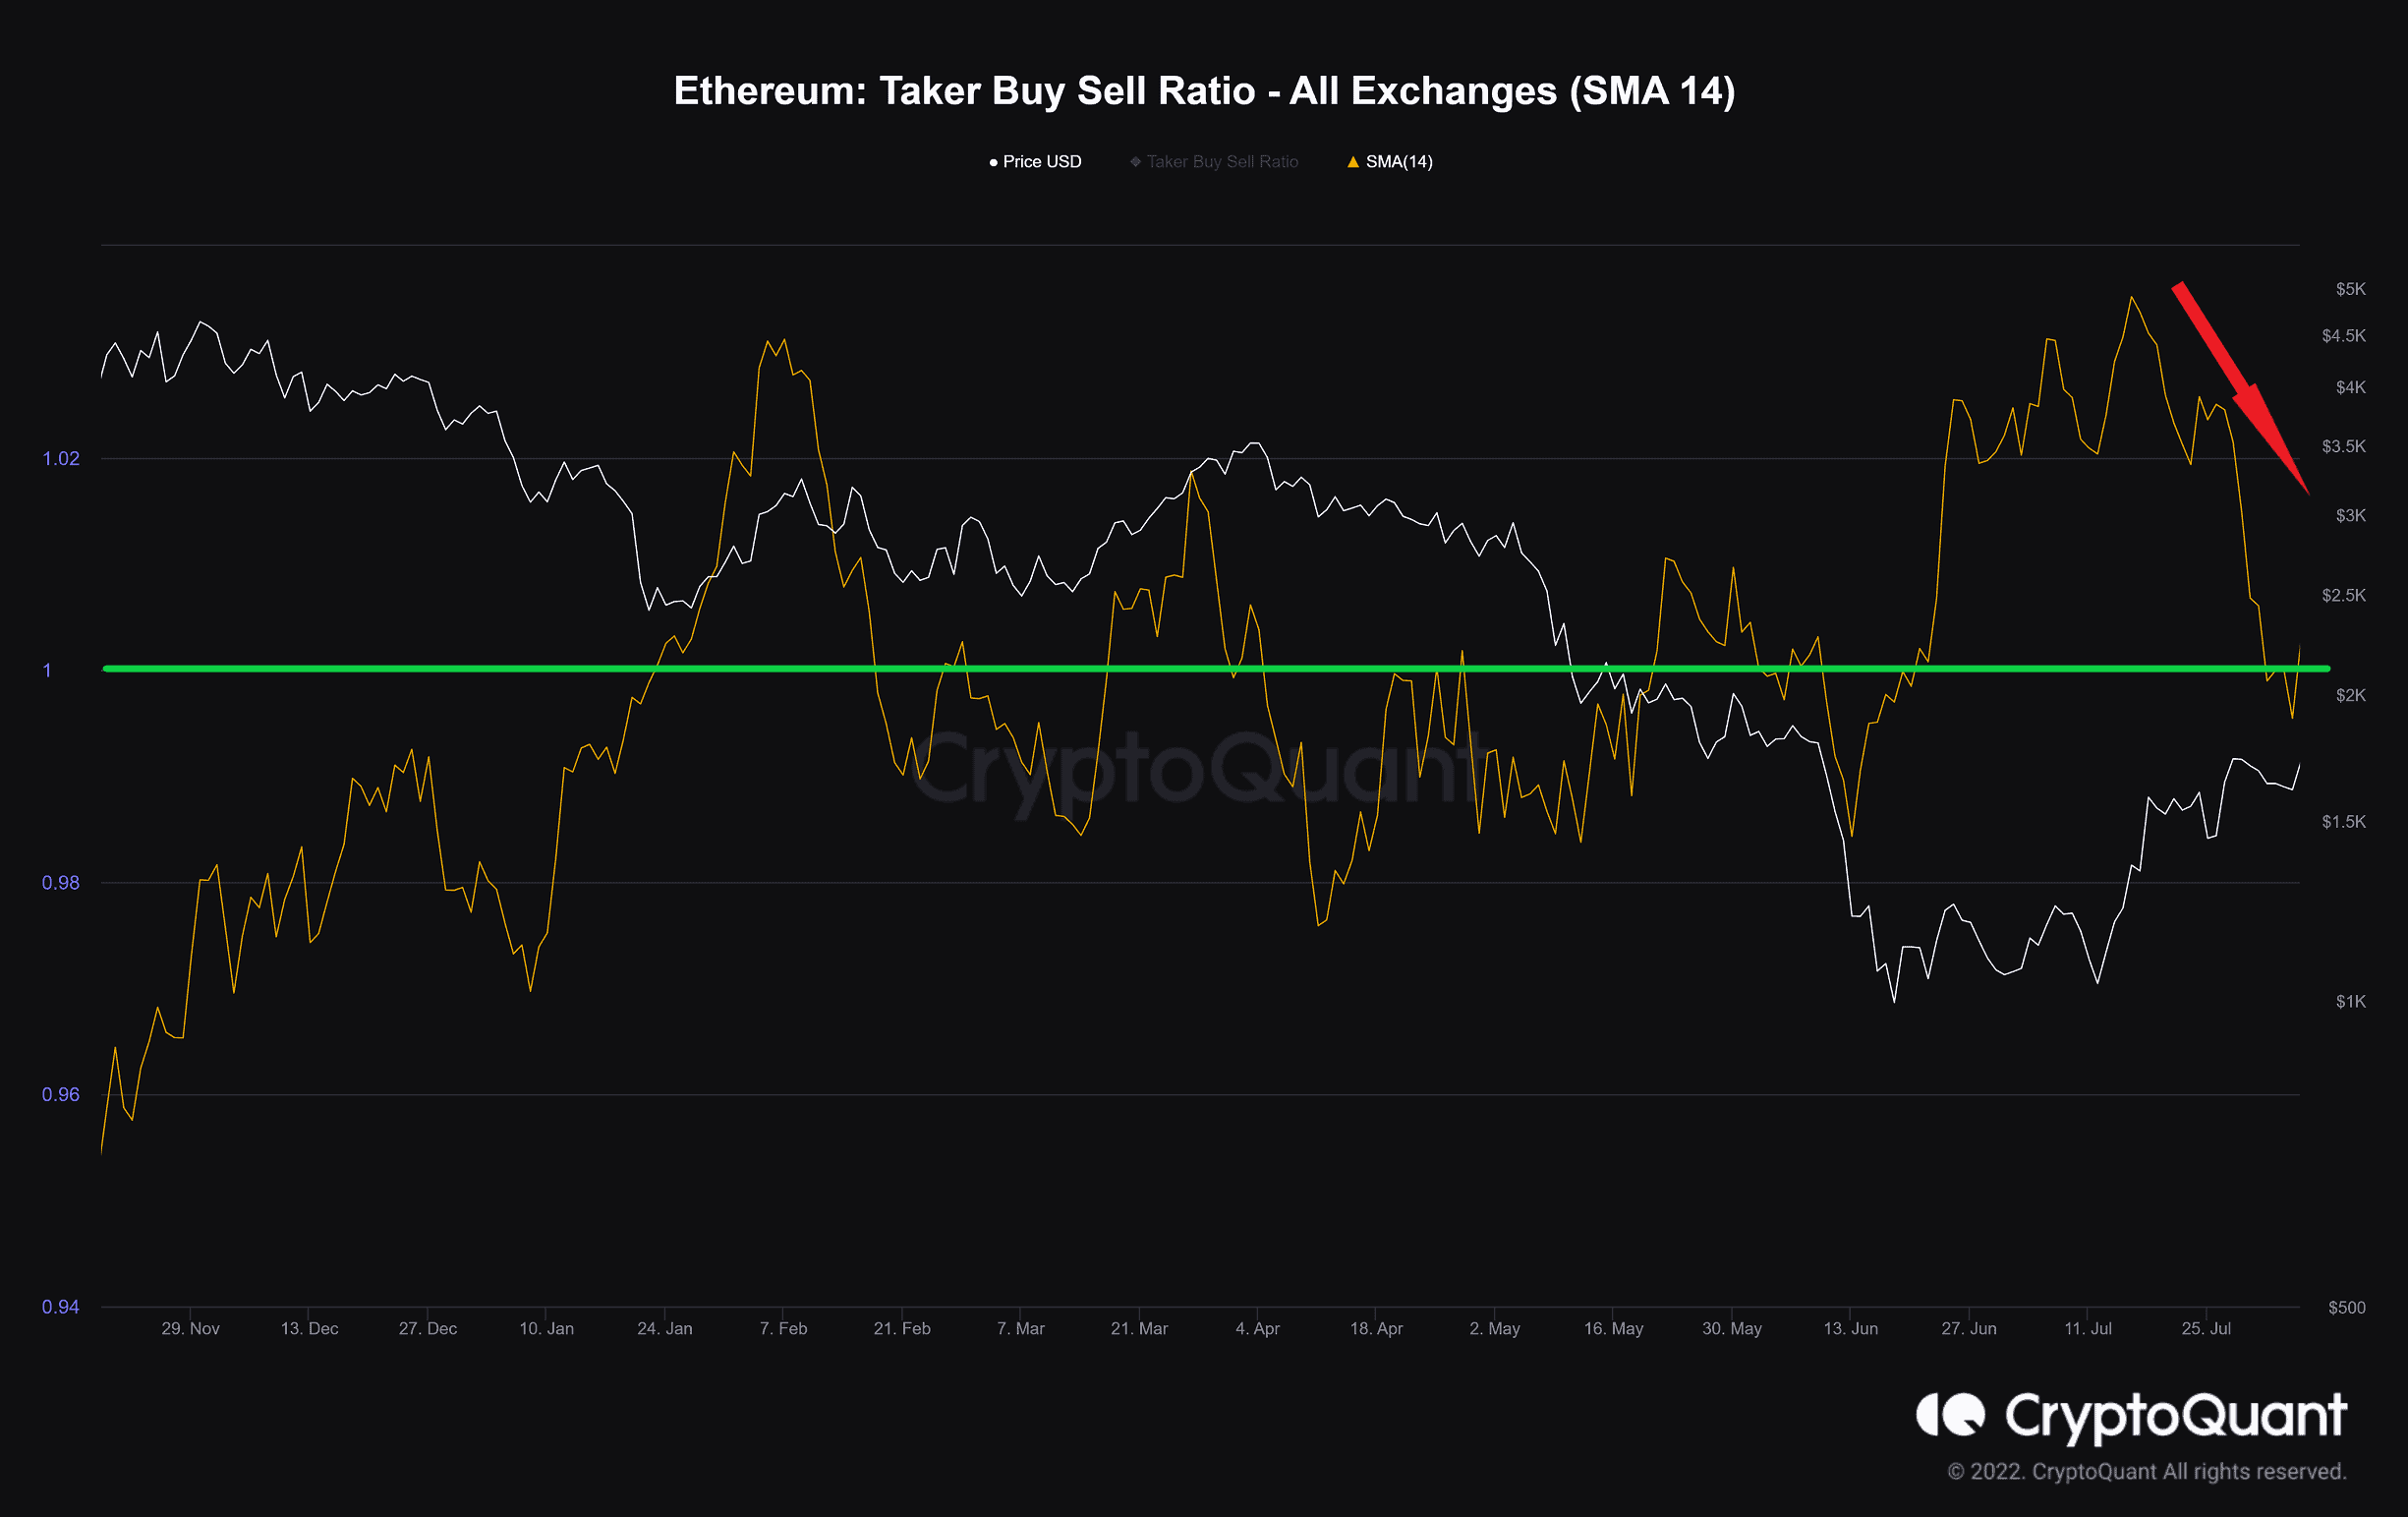
Taker Buy Sell Ratio
Definition: The ratio of buy volume divided by sell volume of takers in perpetual swap trades.
Values over 1 indicate bullish sentiment is dominant.
Values under 1 indicate bearish sentiment is dominant.
Evidently, takers have filled additional buy orders in the last three months. This caused Ethereum to experience a significant price climb. But since July 18, this metric has been moving downwards. Although it is still above the baseline (in green), it suggests that the strength of the takers on the buy side is gradually decreasing. This issue is likely due to profit-taking around the solid resistance by short-term traders.