Here are the Ethereum technical indicators that suggest its probable next price action. Ethereum is trading at $1504.06, down 5.78% in the last 24 hours. It has a market capitalization of $182,292,207,180 with a trading volume of $20,834,153,753.
Relative Strength Index (RSI)
The relative Strength Index is a momentum indicator that shows whether a coin is trading in an oversold or overbought territory using the 14-day moving average. Oversold and overbought territories signal an imminent price reversal/correction.
The Ethereum Relative Strength Index stands at 66, showing it’s neither trading at oversold nor overbought territory.
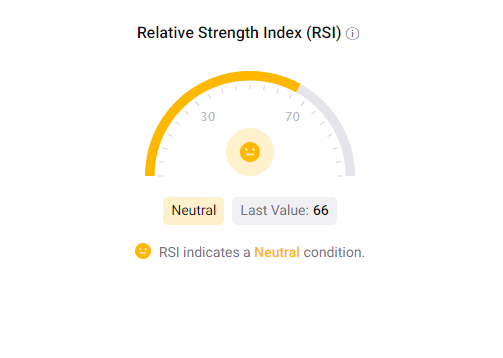
Chart source.
Exchange Netflow, inflow, and outflow
Inflow is the number of coins entering an exchange, while outflow is the number of coins leaving an exchange. Netflow is the difference between inflow and outflow.
Netflow= Inflow – Outflow
The 1 day Ethereum netflow on exchanges stands at -1,595,185.494 with an inflow of 145,169.957 and outflow of 1,740,355.451. The Netflow suggests increasing buying pressure on spot exchanges and low volatility on derivative exchanges.
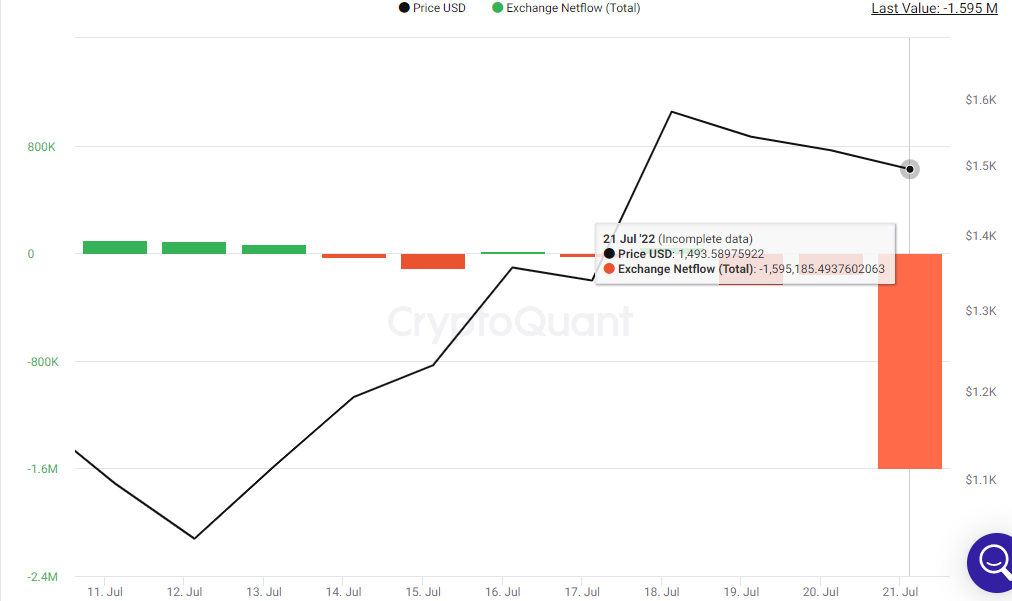
Chart source.
Simple Moving Average (SMA)
A simple Moving Average is the average closing price of an asset over a given period.
Ethereum is trading at $1504.06, below the 200-day simple moving average, signaling a bulish price movement.
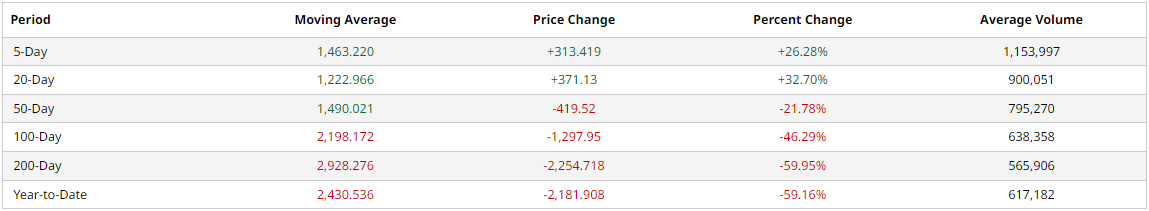
Chart source.
Open Interest (OI)
Open Interest is the number of open positions (long and short) currently on an exchange’s trading pairs.
The Ethereum open interest is increasing, meaning traders are opening trading positions. The move provides liquidity, volatility, and attention, supporting the current price trend.
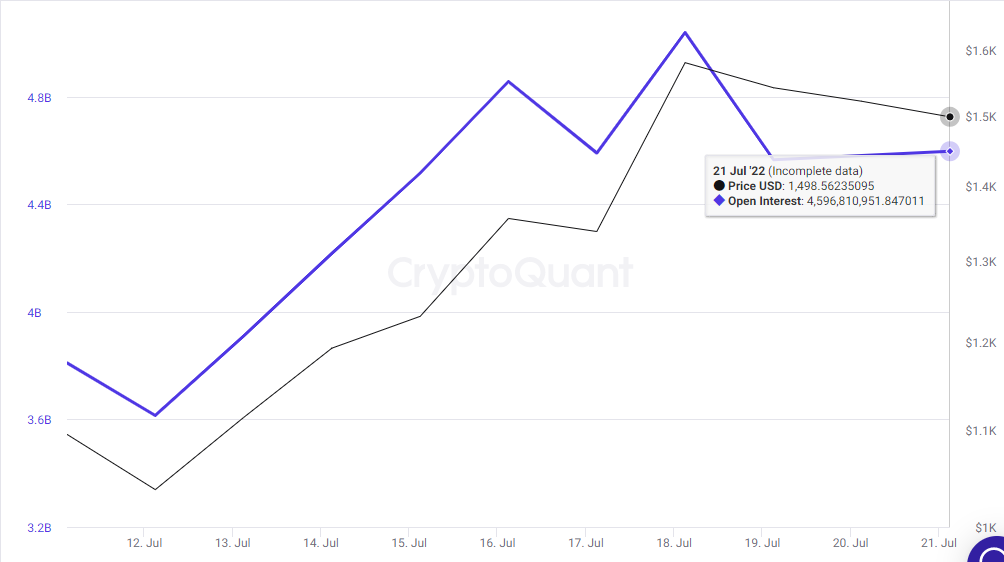
Chart source.
Longs Vs. Shorts
The longs/shorts ratio compares the exchange’s active buying and selling volumes, reflecting Ethereum’s market sentiment.
The Ethereum long/short ratio is 0.88 indicating a negative market sentiment.
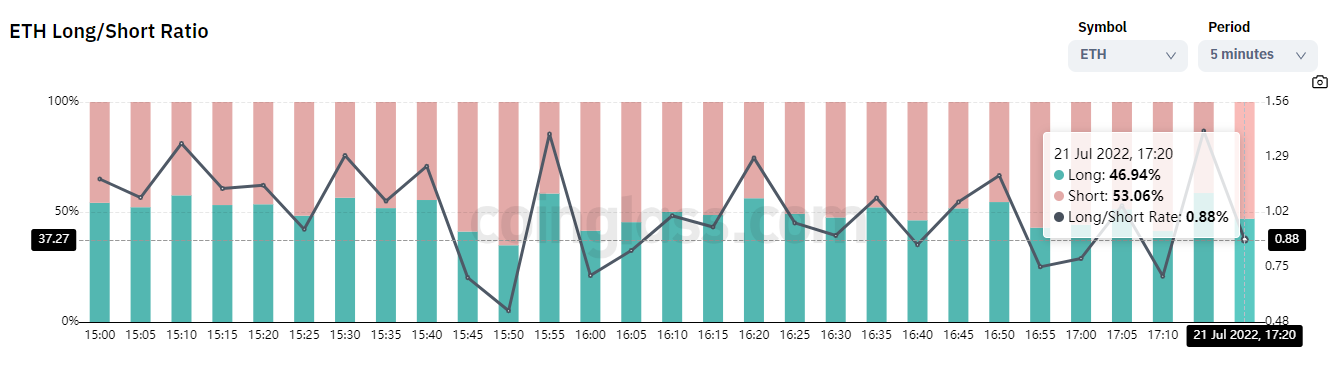
Chart source.