After the worst monthly candle since the Covid crash, the buyers were able to push ETH up by 8% in the last four days.
Technical Analysis
By Grizzly
The Daily Chart
On the daily timeframe, it can be seen that short-term upward trends have occurred when the price crosses the MA20 and breaks the last high (in blue). In the recent leg down, this moving average has acted as a resistance and prevented the price from increasing further. Currently, the MA20 lies at $1,122, and the last high is at $1,300 (in yellow). If buyers can break these levels towards the upside, then one can expect a price increase in the short term.
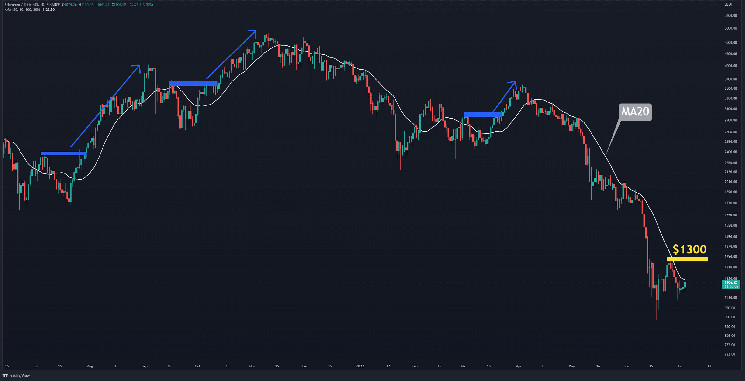
Key Support Levels: $1000 & $900
Key Resistance Levels: $1300 & $1500
Moving Averages:
MA20: $1122
MA50: $1535
MA100: $2231
MA200: $2646
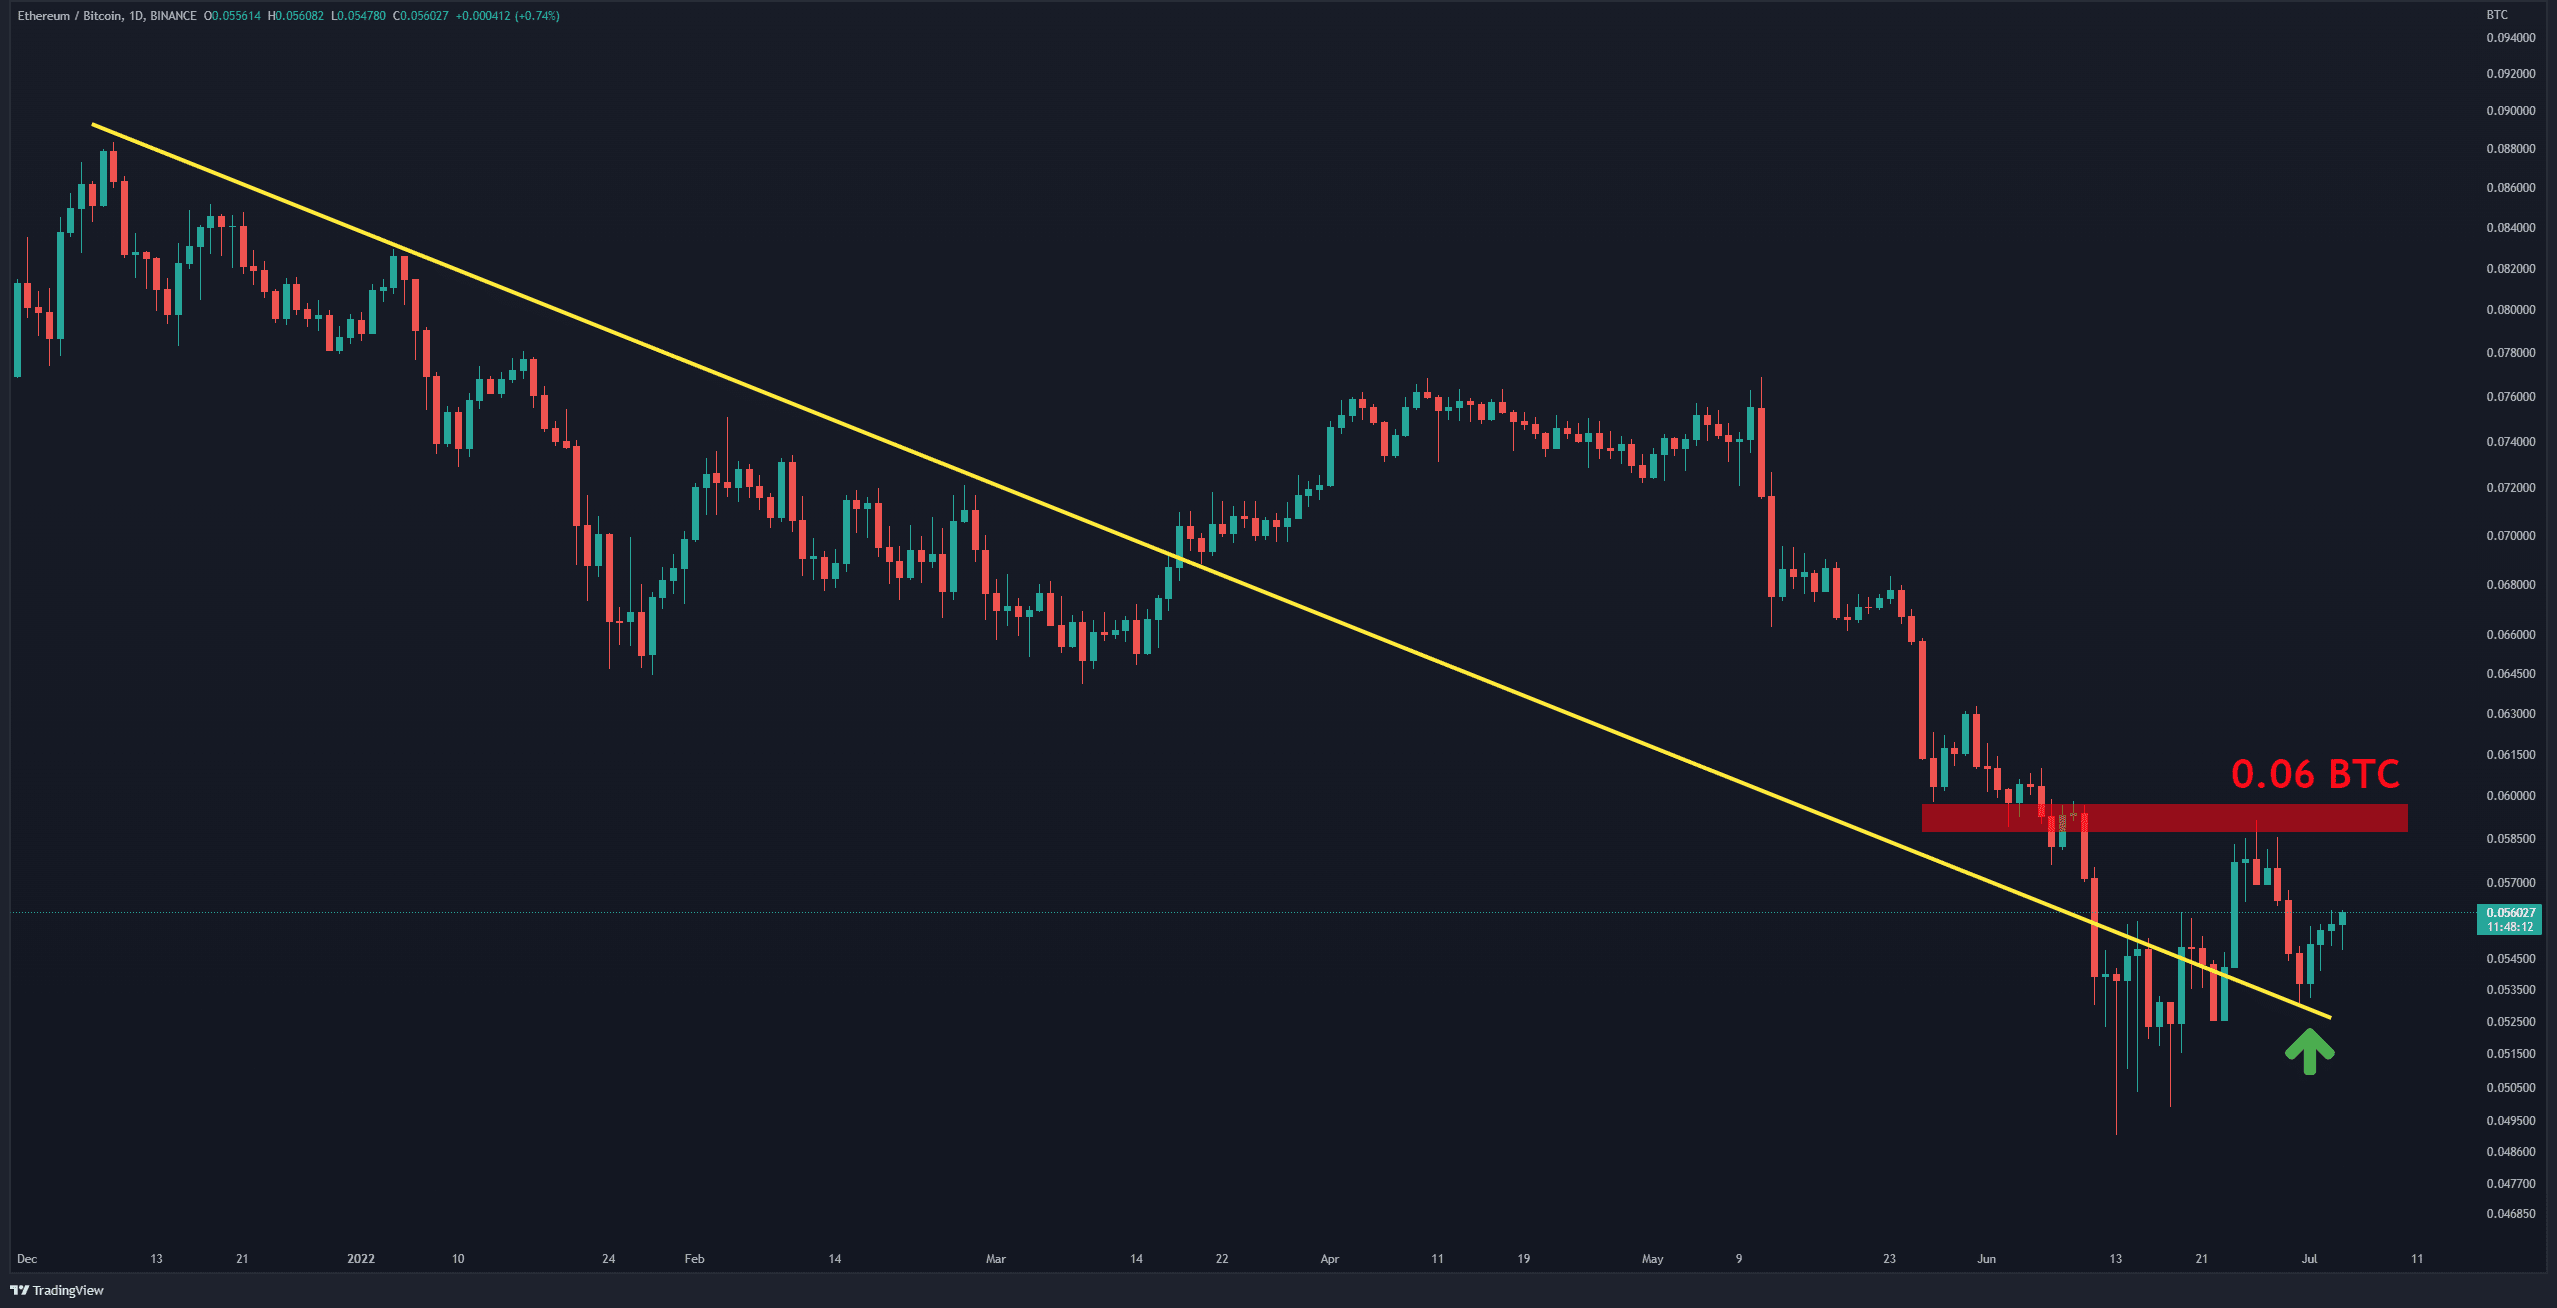
The ETH/BTC Chart
Against BTC, the descending line (in yellow) has acted both as resistance and then as a support level. This line has prevented the price from falling further over the last couple of weeks. Moreover, another critical resistance level at 0.06 BTC (in red) is highlighted here, which the buyers failed to break in the first attempt. If they can break through this barrier, then one can expect the horizontal resistance to be tested at 0.065 BTC. If the bulls are successful in this area and can push the price above 0.065 BTC, then the trend reversal would be confirmed.
On-chain Analysis
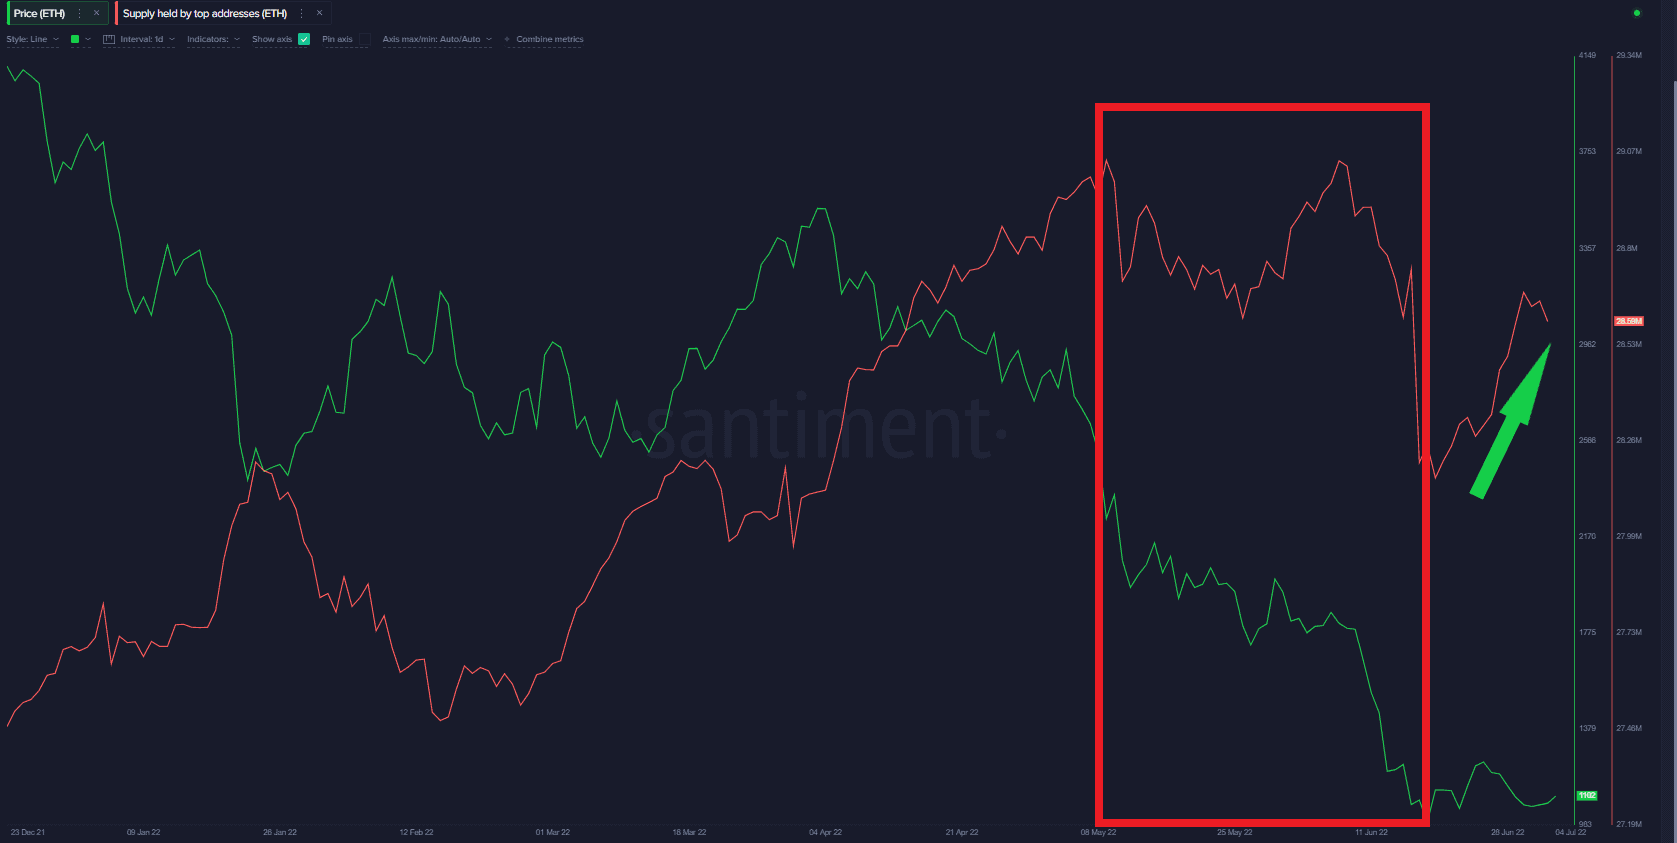
Supply Held By Top Addresses
Definition: This metric shows the combined balance of the top addresses overall. During the sharp drop in May and June, these addresses have reduced their supply and were probably on the selling side. This caused the price to reach lower levels. Their balance decreased from 29 million to 28 million during that period. Now, they are starting to accumulate again. The important item to monitor is whether this accumulation will be continuous or not.