- Support for ETH moving forward: $115, $110.46, $102.55, $101.27, $95, $93.
- Resistance for ETH moving forward: $124.91, $134.67, $146.74, $150, $155.12, $171.94.
Latest Ethereum News
According to data from analytics firm Diar, the on-chain transaction volume for Ethereum has hit an all-time high in December 2018 after a year of falling transaction volumes.
In other Ethereum-related news, it has been revealed that over $16 million have been lost in the recent Cryptopia hack. The hack, which happened on January 14, was the first to occur in 2019. The hacker managed to steal $3 million in Ethereum and the rest in ERC-20 tokens.
Let us continue to take a look at price action for Ethereum over the recent period and highlight any potential areas of support and resistance moving forward.
ETH Price Analysis
Ethereum has seen an small price increase totaling 0.69% over the past 24 hours of trading, bringing the current trading price up to around $118.94, at the time of writing. Ethereum has now seen a 7-day price decline totaling 4.67%, with a further 30-day price fall of 7.69%.
Ethereum is still ranked in 3rd position and now holds a $12.27 billion market cap value. The 42-month old decentralized operating system is now trading at a value that is 91% lower than the all-time high price.
ETH/USD Price
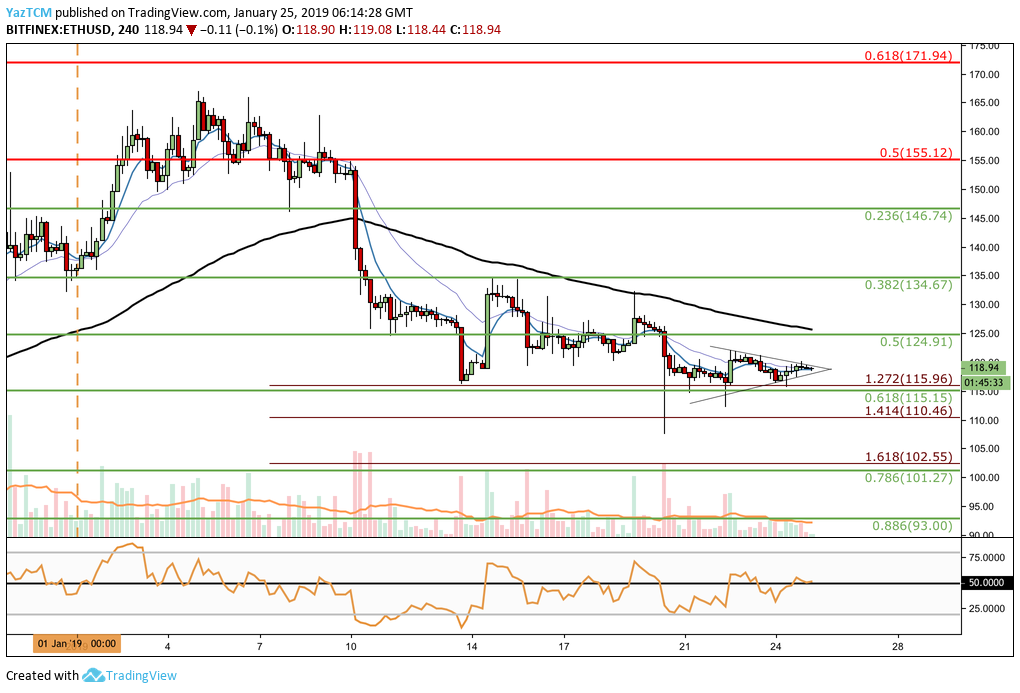
Taking a look at price action for ETH/USD from the 4-hour chart above, we can see that since our last analysis for Ethereum, price action has continued to trade sideways over the following few days.
The market has now established a very acute symmetrical triangle over the past 2 or 3 days as price action now proceeds to approach the apex.
A breakout above or below the current symmetrical triangle will signal which direction the market may be heading towards next, providing the breakout comes with an increase in volume.
Trend: Neutral
The market has been trading sideways over the past few days leading to a neutral trading condition. If price action breaks below the acute symmetrical triangle and falls below $115, we can then consider the market to be bearish.
A price action break above the $135 handle would indicate a bullish market.
Where is the Support Located Below the Symmetrical Triangle?
If ETH/USD goes below the lower boundary of the symmetrical triangle, we can expect immediate support towards the downside to be located at the short-term 1.272 Fibonacci Extension level (drawn in red) priced at $115.96.
This area of support is further bolstered by a short-term .618 Fibonacci Retracement level (drawn in green) priced at $115.15.
If the bears continue to push ETH/USD below the $115 handle, there is more support below at the short-term downside 1.414 Fibonacci Extension level (drawn in red) priced at $110.46.
Further support below the $110 handle is then expected at the short-term downside 1.618 Fibonacci Extension level (drawn in red) priced at $102.55, closely followed by more support at the short-term .786 Fibonacci Retracement level (drawn in green) priced at $101.27.
Where is the Resistance Located Above the Symmetrical Triangle?
If the bulls cause price action to break above the upper boundary of the symmetrical triangle, we can expect immediate higher resistance to be located at the short-term .5 Fibonacci Retracement level (drawn in green) priced at $124.91.
Above the $130 handle, we can expect more resistance at the short-term .382 and .236 Fibonacci Retracement level (drawn in green) priced at $134.67 and $146.74, respectively.
If the bullish pressure can then continue to push ETH/USD above $150, higher resistance can then be found at the bearish .5 and .618 Fibonacci Retracement levels (drawn in red), priced at $155.12 and $171.94 respectively.
ETH/BTC Price
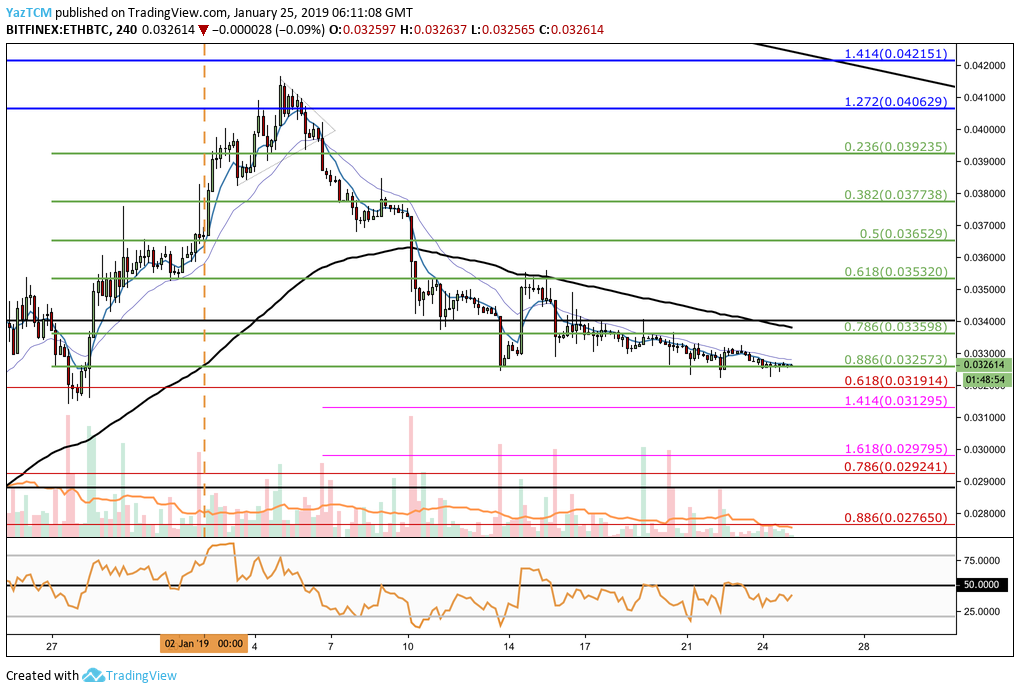
Analyzing the market from the 4-hour perspective above, we can see that ETH/BTC has continued to trade along the support provided by the short-term .886 Fibonacci Retracement level (drawn in green) priced at 0.03257 SATS.
Price action has held at this level of support quite well over the past few days.
Trend: Neutral
The market is holding the support at the 0.03257 SATS handle which leads to this market being neutral in the short term.
If price action does break below the support at 0.03257 SATS, then the market can be considered as bearish in the short term. For this market to be considered bullish, we would need to see price action break above the 0.03532 SATS level.
Where is the Support for ETH/BTC?
If price action breaks below 0.03257 SATS, we can expect immediate support below to be located at the long-term .618 Fibonacci Retracement level (drawn in red) priced at 0.03191 SATS. This is closely followed by more support at the short-term downside 1.414 FIbonacci Extension level (drawn in pink) priced at 0.03129 SATS.
If ETH/BTC drops below the 0.030 handle, then further support below can be expected at the short-term downside 1.618 Fibonacci Extension level (drawn in pink) priced at 0.02979 SATS. There is also more support at the long-term .7866 Fibonacci Retracement level (drawn in red) priced at 0.02924 SATS.
Where is the Resistance Above the Market?
If the bulls begin to push price action higher from the support at 0.03257 SATS, we can expect immediate resistance at the short-term .786 and .618 Fibonacci Retracement levels (drawn in green), priced at 0.03359 SATS and 0.03532 respectively.
If the bullish momentum continues to push price action higher, then there is more resistance towards the upside at the short-term .5 and .382 Fibonacci Retracement levels (drawn in green), priced at 0.03652 SATS and 0.03773 SATS respectively.
Conclusion
The Ethereum market is holding strongly at the support levels identified above.
If the ETH/USD market can break above the symmetrical triangle, then we can expect price action to continue higher. However, if ETH/BTC falls below the support at 0.03257 SATS, then we could see ETH/USD break below the lower boundary of the symmetrical triangle and head further lower.