After ten weeks of red, the bears were able to push the price below $1,000 yesterday. They managed to advance below $900, but the market saw a quick recovery and reclaimed on top of the covered $1K mark. However, things are still very fragile.
Technical Analysis
Technical Analysis By Grizzly
The Daily Chart
On the daily timeframe, ETH has reached a support zone lastly tested on January 2021. Despite the severe drop, of over 30% this week alone, the bearish momentum is still high: The consecutive weekly red candlesticks indicate the bear’s complete dominance in the market.
Examining the chart below, the support zone in the range of $700-$880 is considered the area that currently has the potential to reverse the trend in the short term. Hence, buyers are likely to seek entrance to the market in this area.
If a reversal plays out, we can expect the price to increase and retest the horizontal resistance at $1300. However, because ETH had experienced a sharp drop, it shouldn’t be so easy to start a new healthy uptrend so soon.
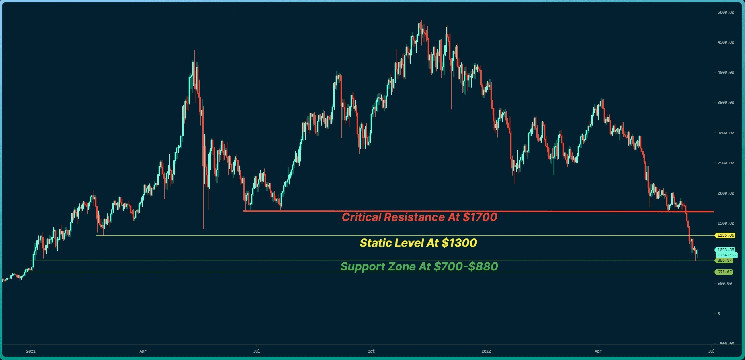
Key Support Levels: $880 & $700
Key Resistance Levels: $1300 & $1500 & $1700
Moving Averages:
MA20: $1536
MA50: $1932
MA100: $2490
MA200: $2871
The ETH/BTC Chart
On the BTC pair chart, the price of ETH against BTC fluctuates between 0.05 BTC and 0.055 BTC over the past ten days. The intersection of the descending Line (in yellow) as support and the horizontal support at 0.05 BTC (in green) so far proved themselves as strong support levels.
In the following chart, the area considered Potential Reversal Zone (PRZ) is in the range of 0.045-0.05 BTC. On the other hand, the trend can be reversed when buyers are finally able to push the price above the horizontal resistance at 0.064 BTC.
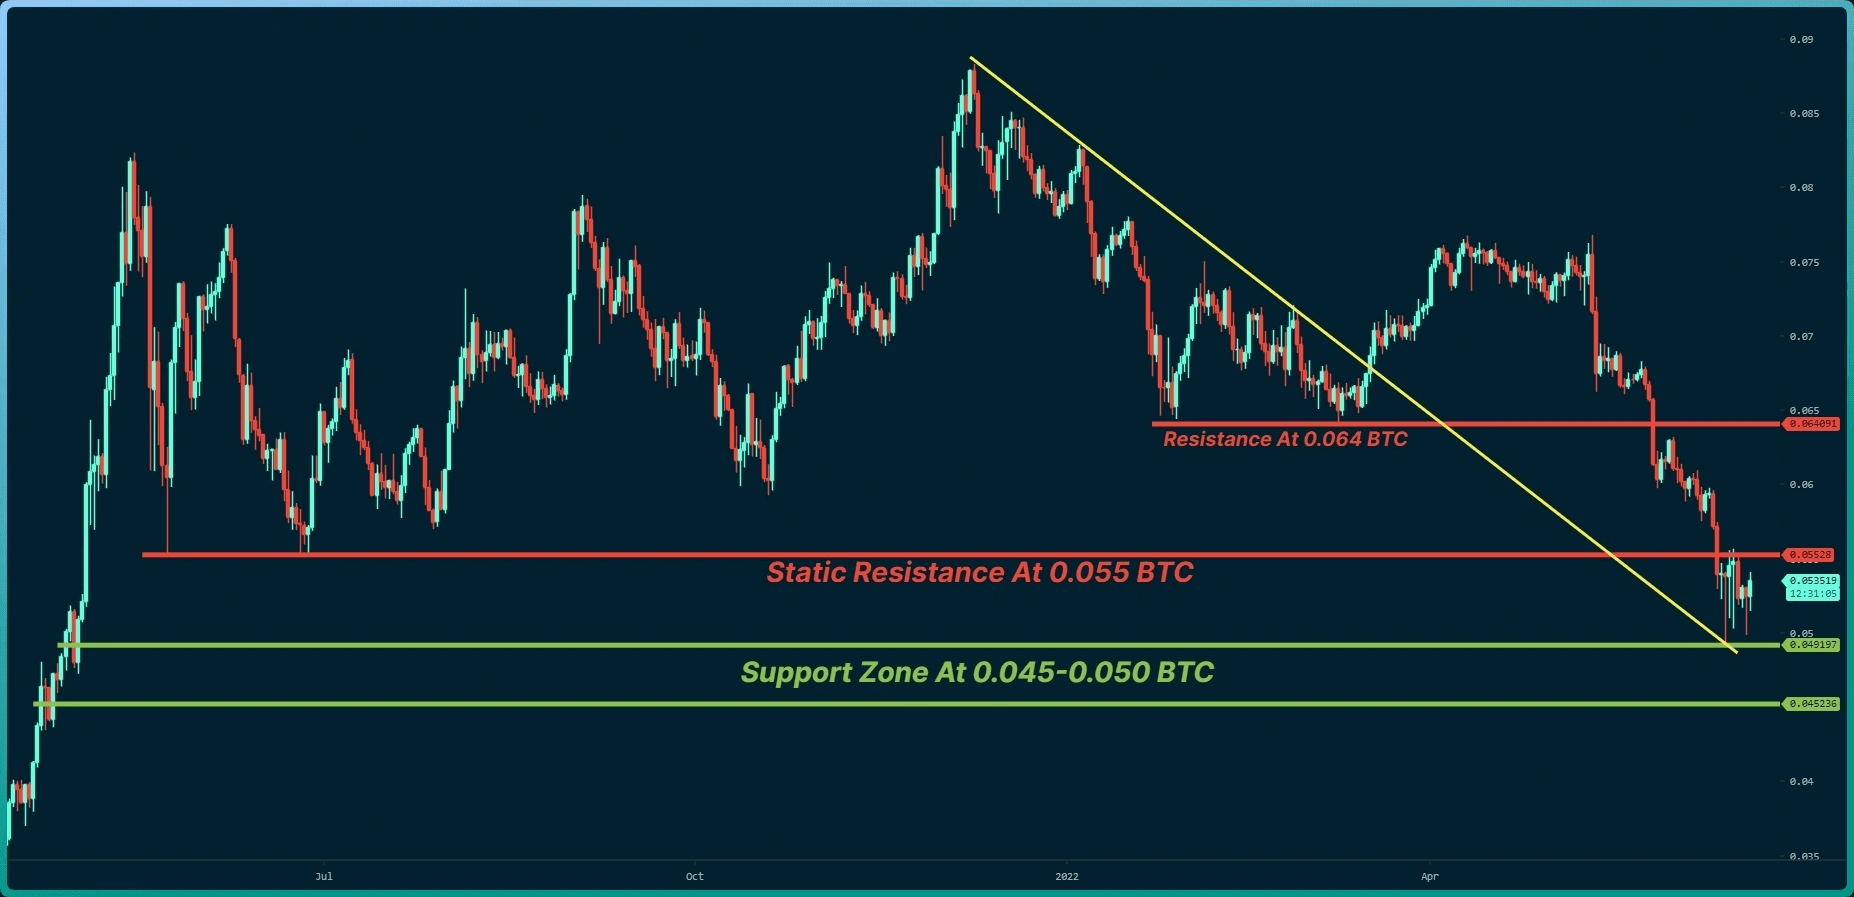
Key Support Levels: 0.050 BTC & 0.0.045 BTC
Key Resistance Levels: 0.055 BTC & 0.06 BTC
On-chain Analysis
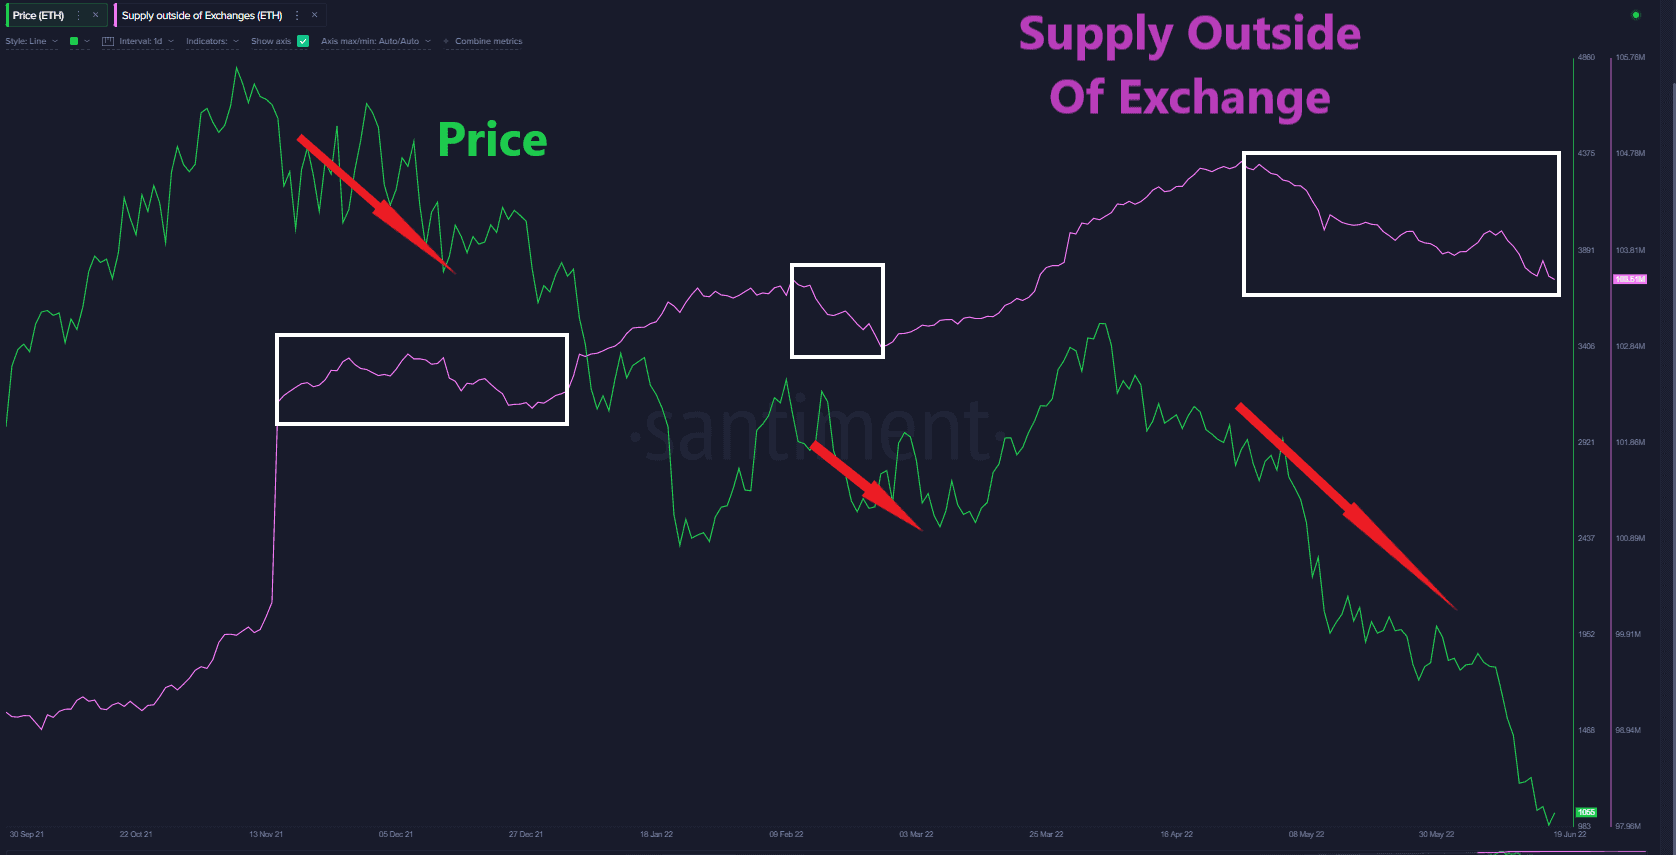
Supply Outside Of Exchange
As shown below, when the supply of ETH outside of exchange drops, a price reduction is often followed. This supply will likely get deposited into the exchanges, increasing the selling pressure.
At present, this metric continues its downward trend. Therefore, the selling pressure is expected to persist until this slope is inverted.