Ethereum (ETH) has been increasing since May 27, in a short-term upward movement that was preceded by an RSI breakout.
The weekly chart shows that ETH has been falling since reaching an all-time high price of $4,868 on Nov 10. The downward movement led to a low of $1,700 on May 27.
The decrease was preceded by a bearish divergence in the weekly RSI (black line). The trendline of the divergence is still intact.
Another interesting development is the fact that the weekly RSI has reached a low of 33 (black icon). A similar low marked the 2016 bottom (red icon). The only other time the weekly RSI was lower was during Dec 2018, when it reached a low of 28 (red circle). So, the current RSI reading has been historically associated with bottoms.
The price is currently trading inside the $1,920 support area. This is a crucial support area since it is the 0.618 Fib retracement support level and a horizontal support area.
Whether ETH bounces or breaks down below it could very well determine the direction of the future trend.
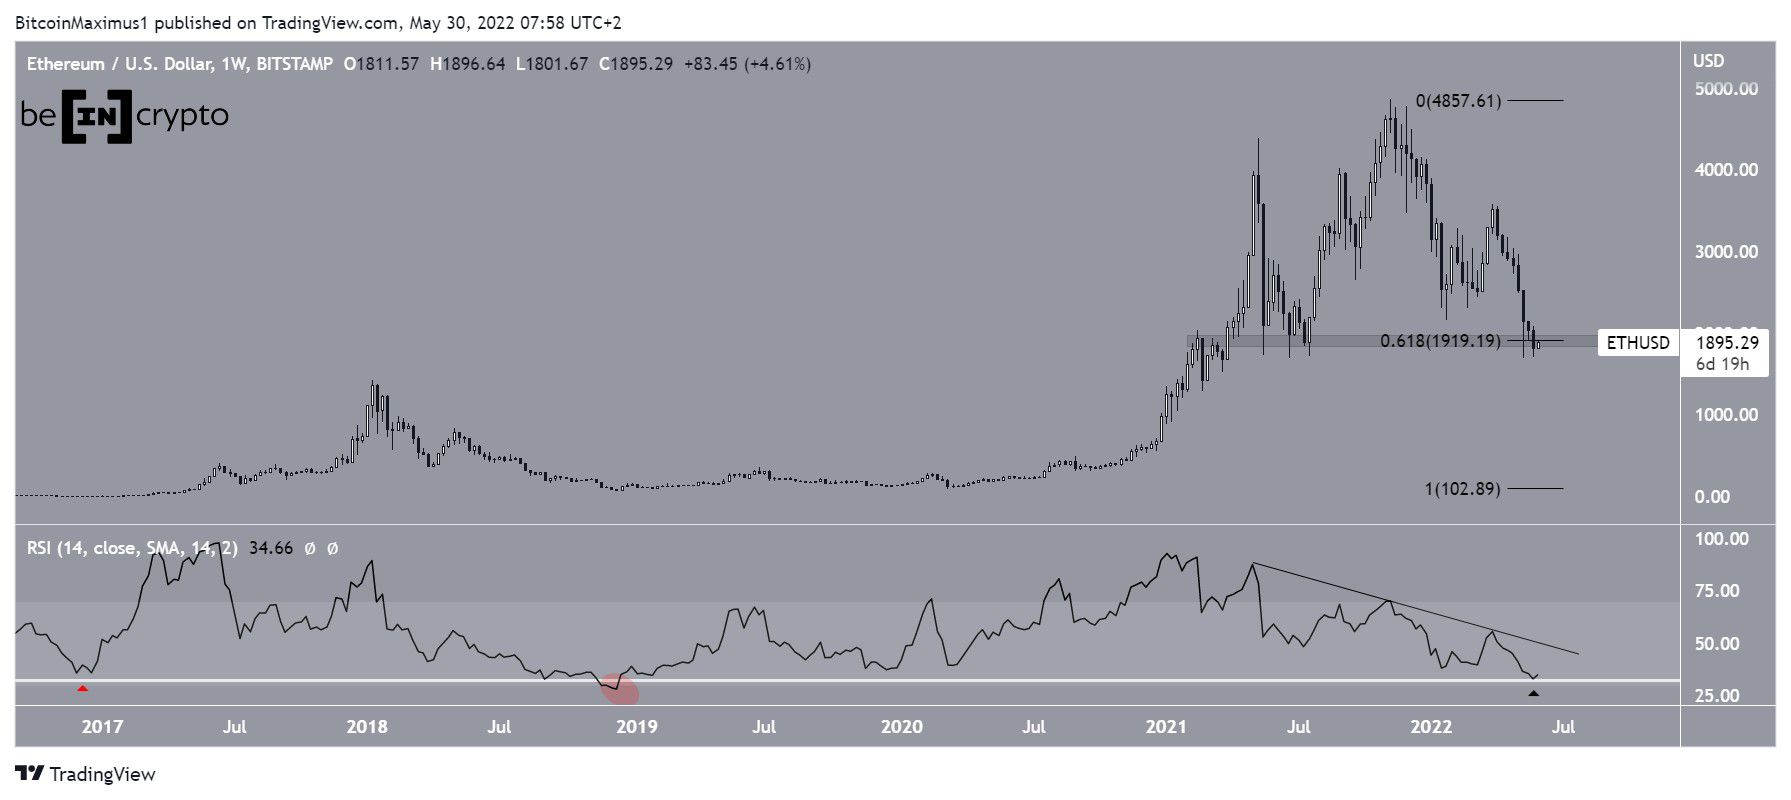
To sum up, the weekly chart shows that the price is trading at an area that could act as the bottom, an interpretation also supported by the weekly RSI. If ETH was to bounce at the current level, and the RSI were to break out from its bearish trendline, it would indicate that the bottom is in.
Ongoing bounce
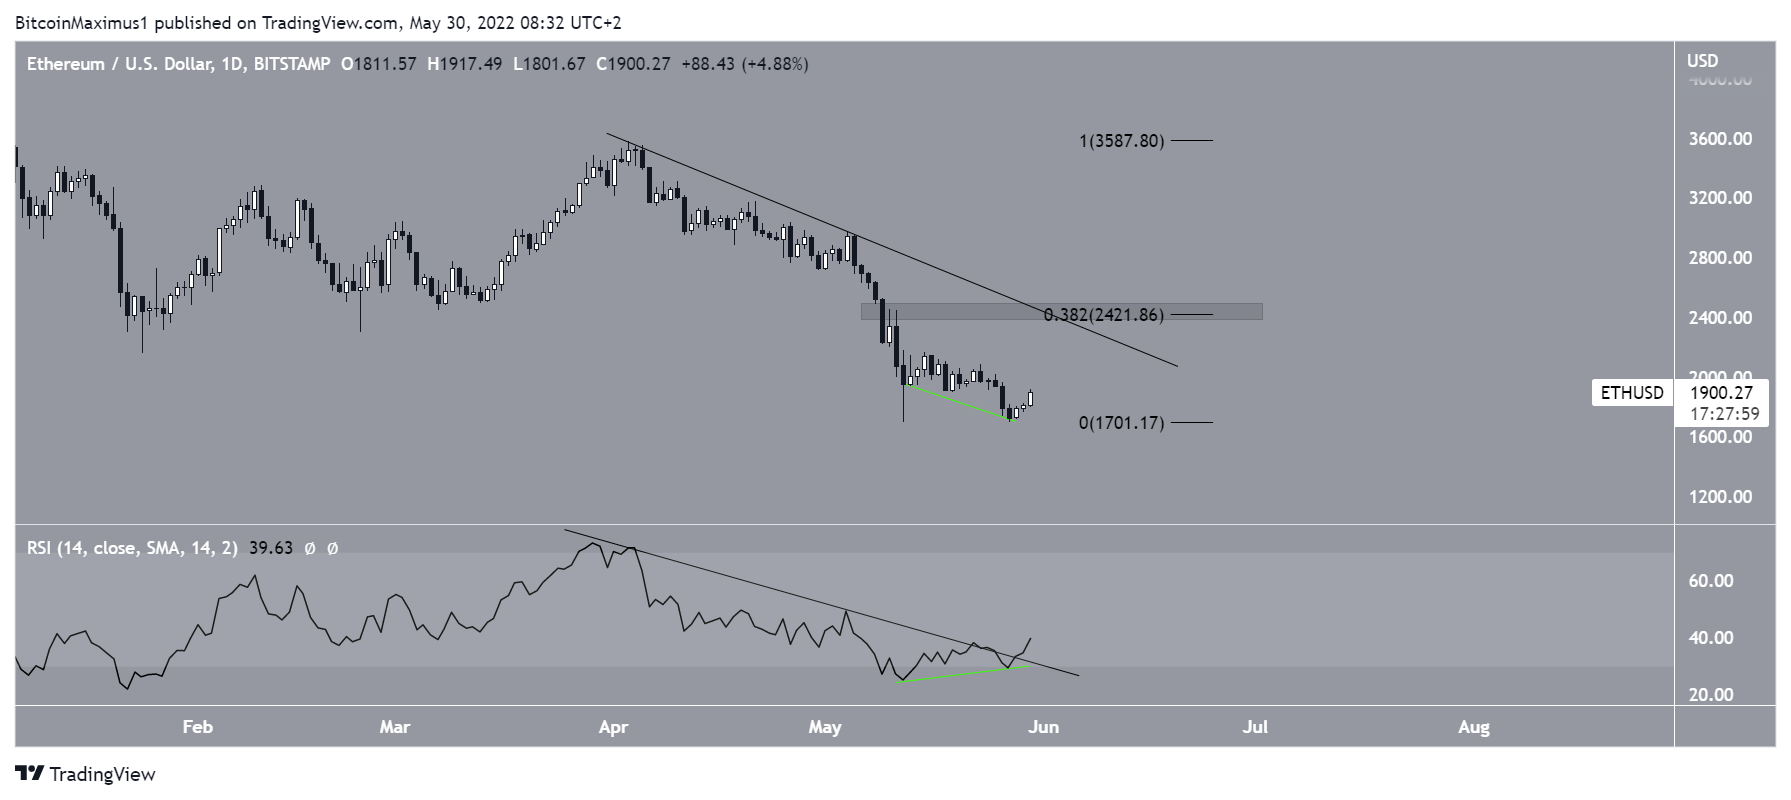
The daily RSI supports the interpretation from the weekly one, in which ETH might have reached a bottom.
The reason for this is that the RSI has generated bullish divergence (green line), and broke out from a descending trendline (black) afterward. Such trendline breaks usually precede a breakout in price.
The descending resistance line that is parallel to that of the RSI is currently at $2,420. This is a crucial level since it is both the 0.382 Fib retracement resistance level and a horizontal resistance area.
A breakout above it would suggest that the bottom is likely in.
ETH wave count analysis
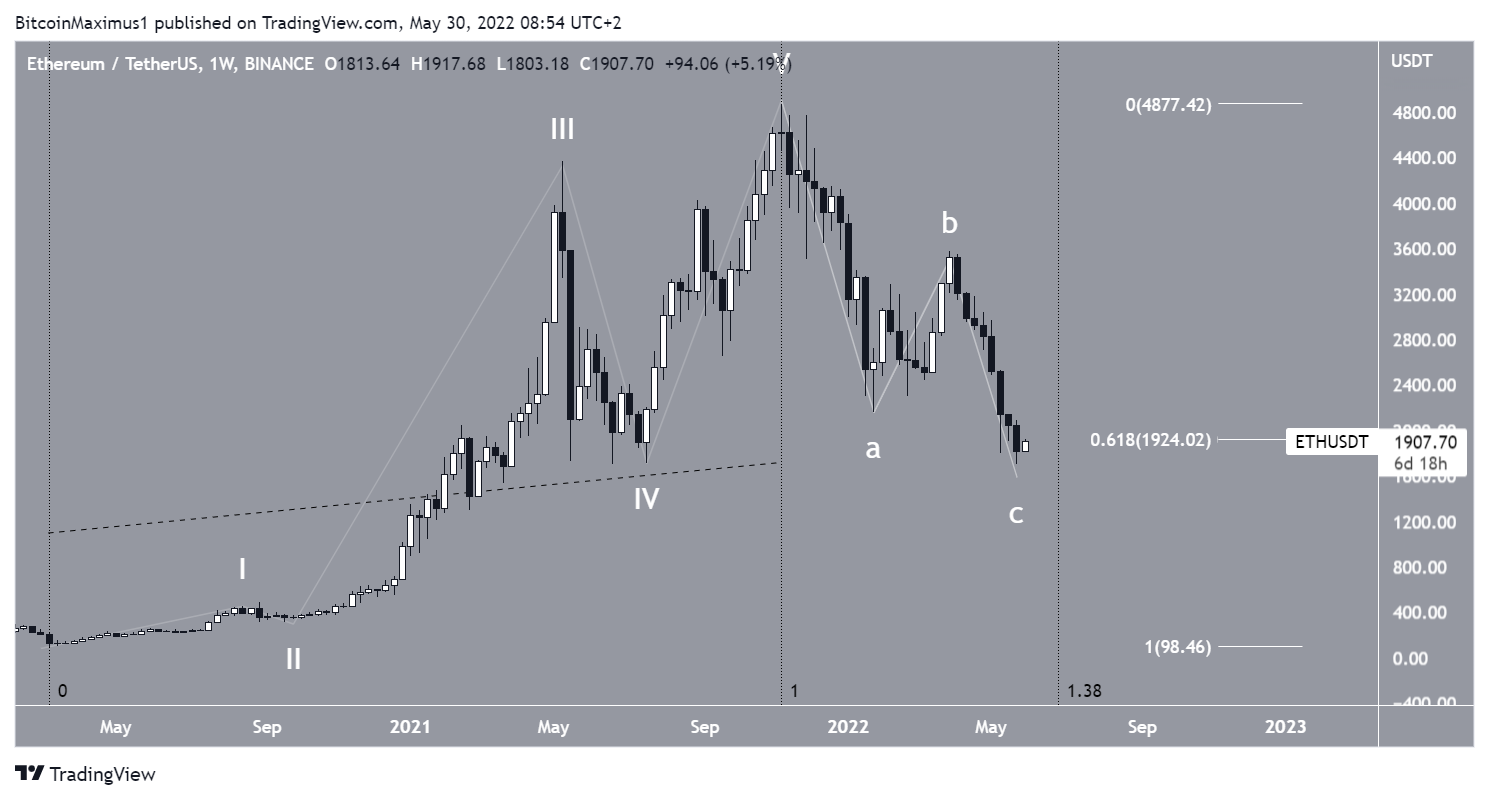
The most likely wave count suggests that since March 2020, ETH has completed some sort of a long-term five-wave upward movement (white). If so, it is currently completing an A-B-C corrective structure as a result of that upward movement.
While the magnitude of the movement fits with a completed correction, since the price is at the 0.618 Fib retracement support level, the time the move took to complete does not.
If this is indeed the correct count, the correction would have been less than 0.382 times longer than the upward movement, which is somewhat unusual for such structures.
However, it is not enough to invalidate this count, since the count fits with the RSI reading and the price action.
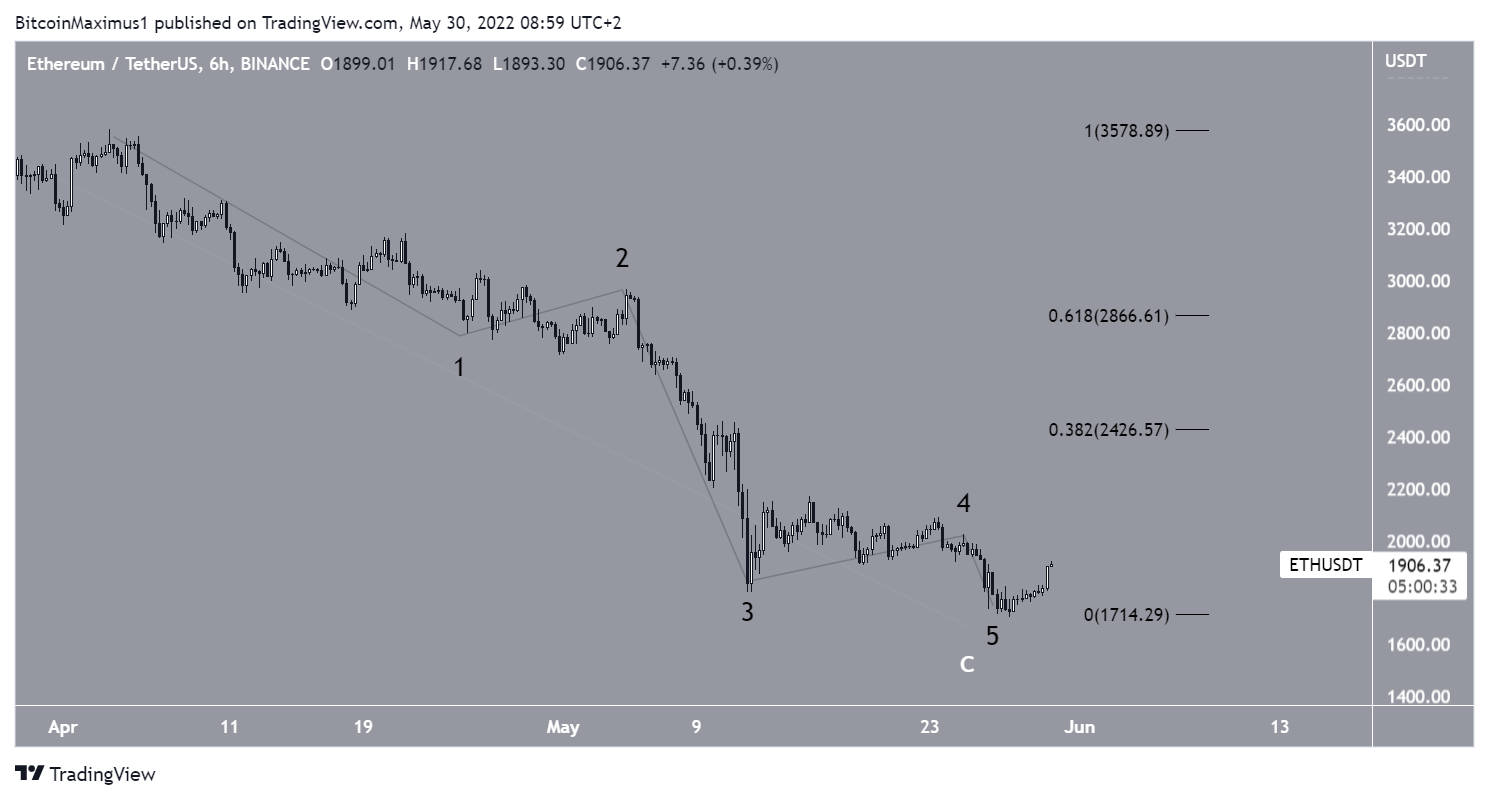
Cryptocurrency trader @TAfxcryptolab tweeted a chart of ETH, stating that the price is likely in wave five of a five-wave downward movement.
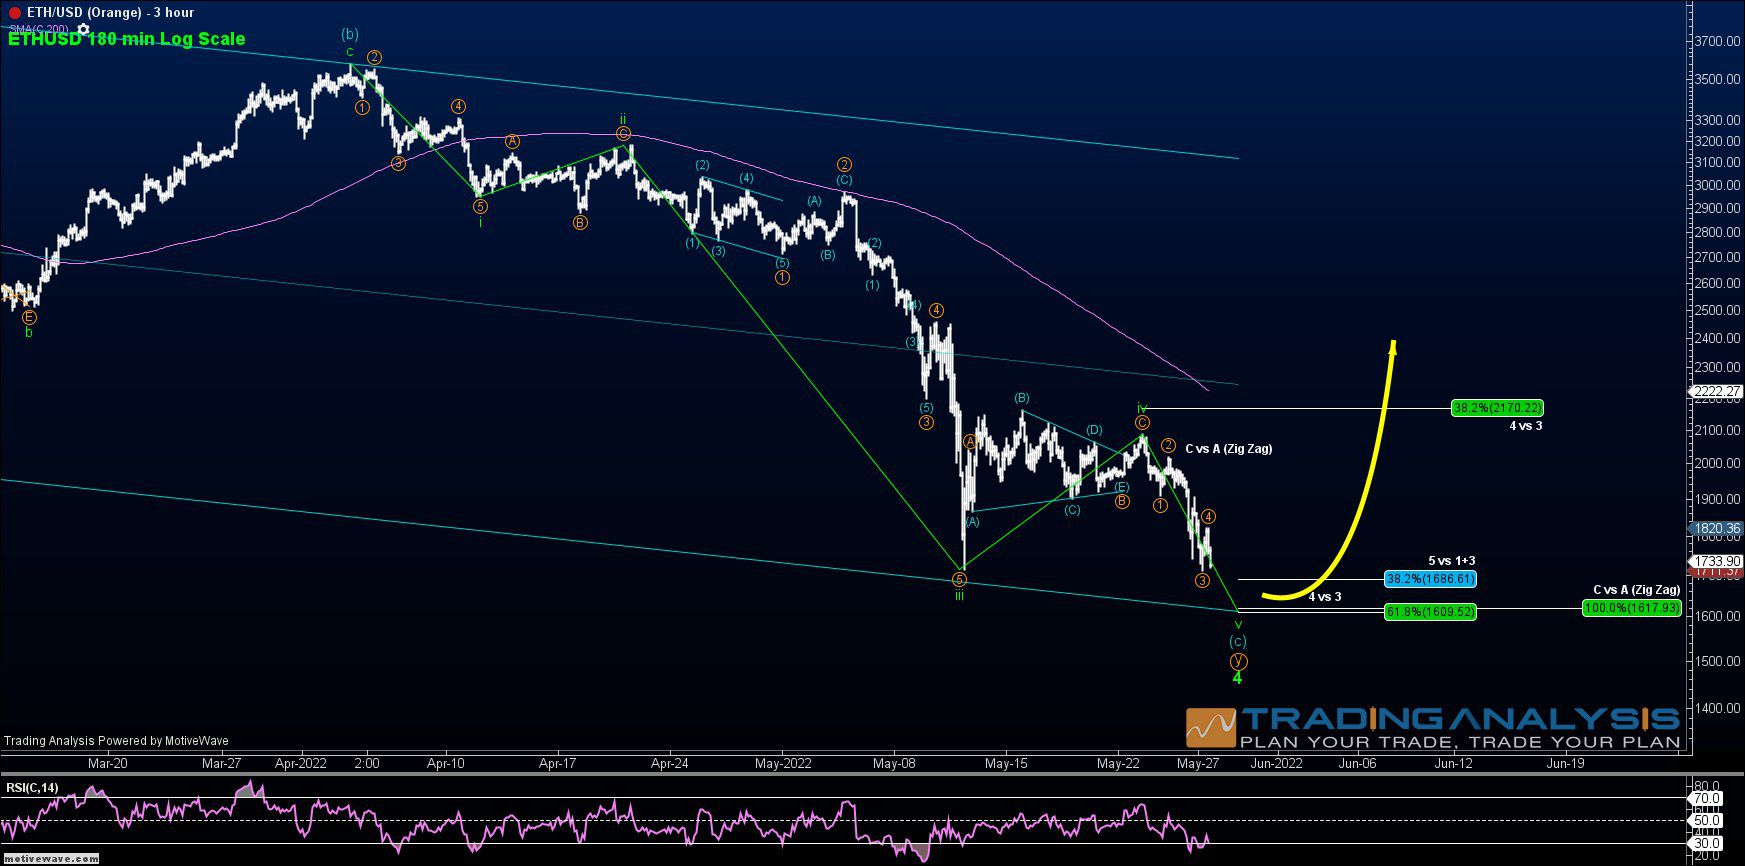
The most likely short-term count does suggest that ETH has completed a five-wave downward movement. Besides the short wave five (black), this seems to be a textbook formation.
In line with the readings from other time frames, it suggests that an increase towards at least $2,400 is likely.
For Be[in]Crypto’s latest bitcoin (BTC) analysis, click here