Ethereum failed to consolidate above $2,000 and is once again found below that level. The sellers seem to have the upper hand as even the ETH/BTC chart is currently at the center of many discussions.
Technical Analysis
By Grizzly
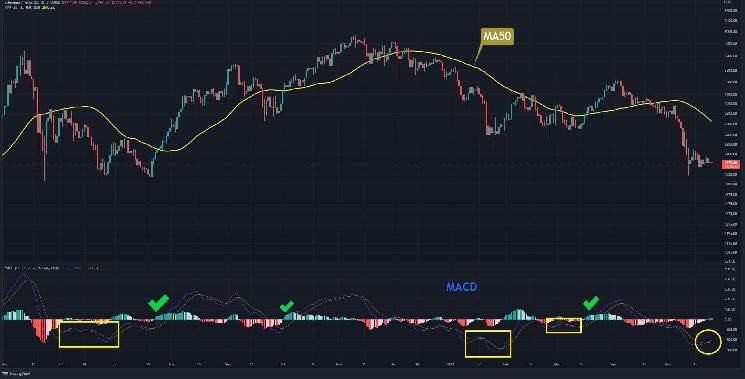
The Daily Chart
Breaking the MACD line by the Signal line (yellow circle) is largely considered a bullish signal in the daily timeframe. This has happened in the past, as shown by the chart with the yellow rectangle. However, the price has continued to move down in each case. In other words – there must be more than one confirmation to signal a reversal.
The bullish momentum is usually initiated when the MACD and the signal lines both enter the positive side while the price breaks the daily MA50. This can be considered a more convincing confirmation.
Key Support Levels: $1700 & $1500
Key Resistance Levels: $2200 & $2450
Moving Averages:
MA20: $2130
MA50: $2645
MA100: $2775
MA200: $3226
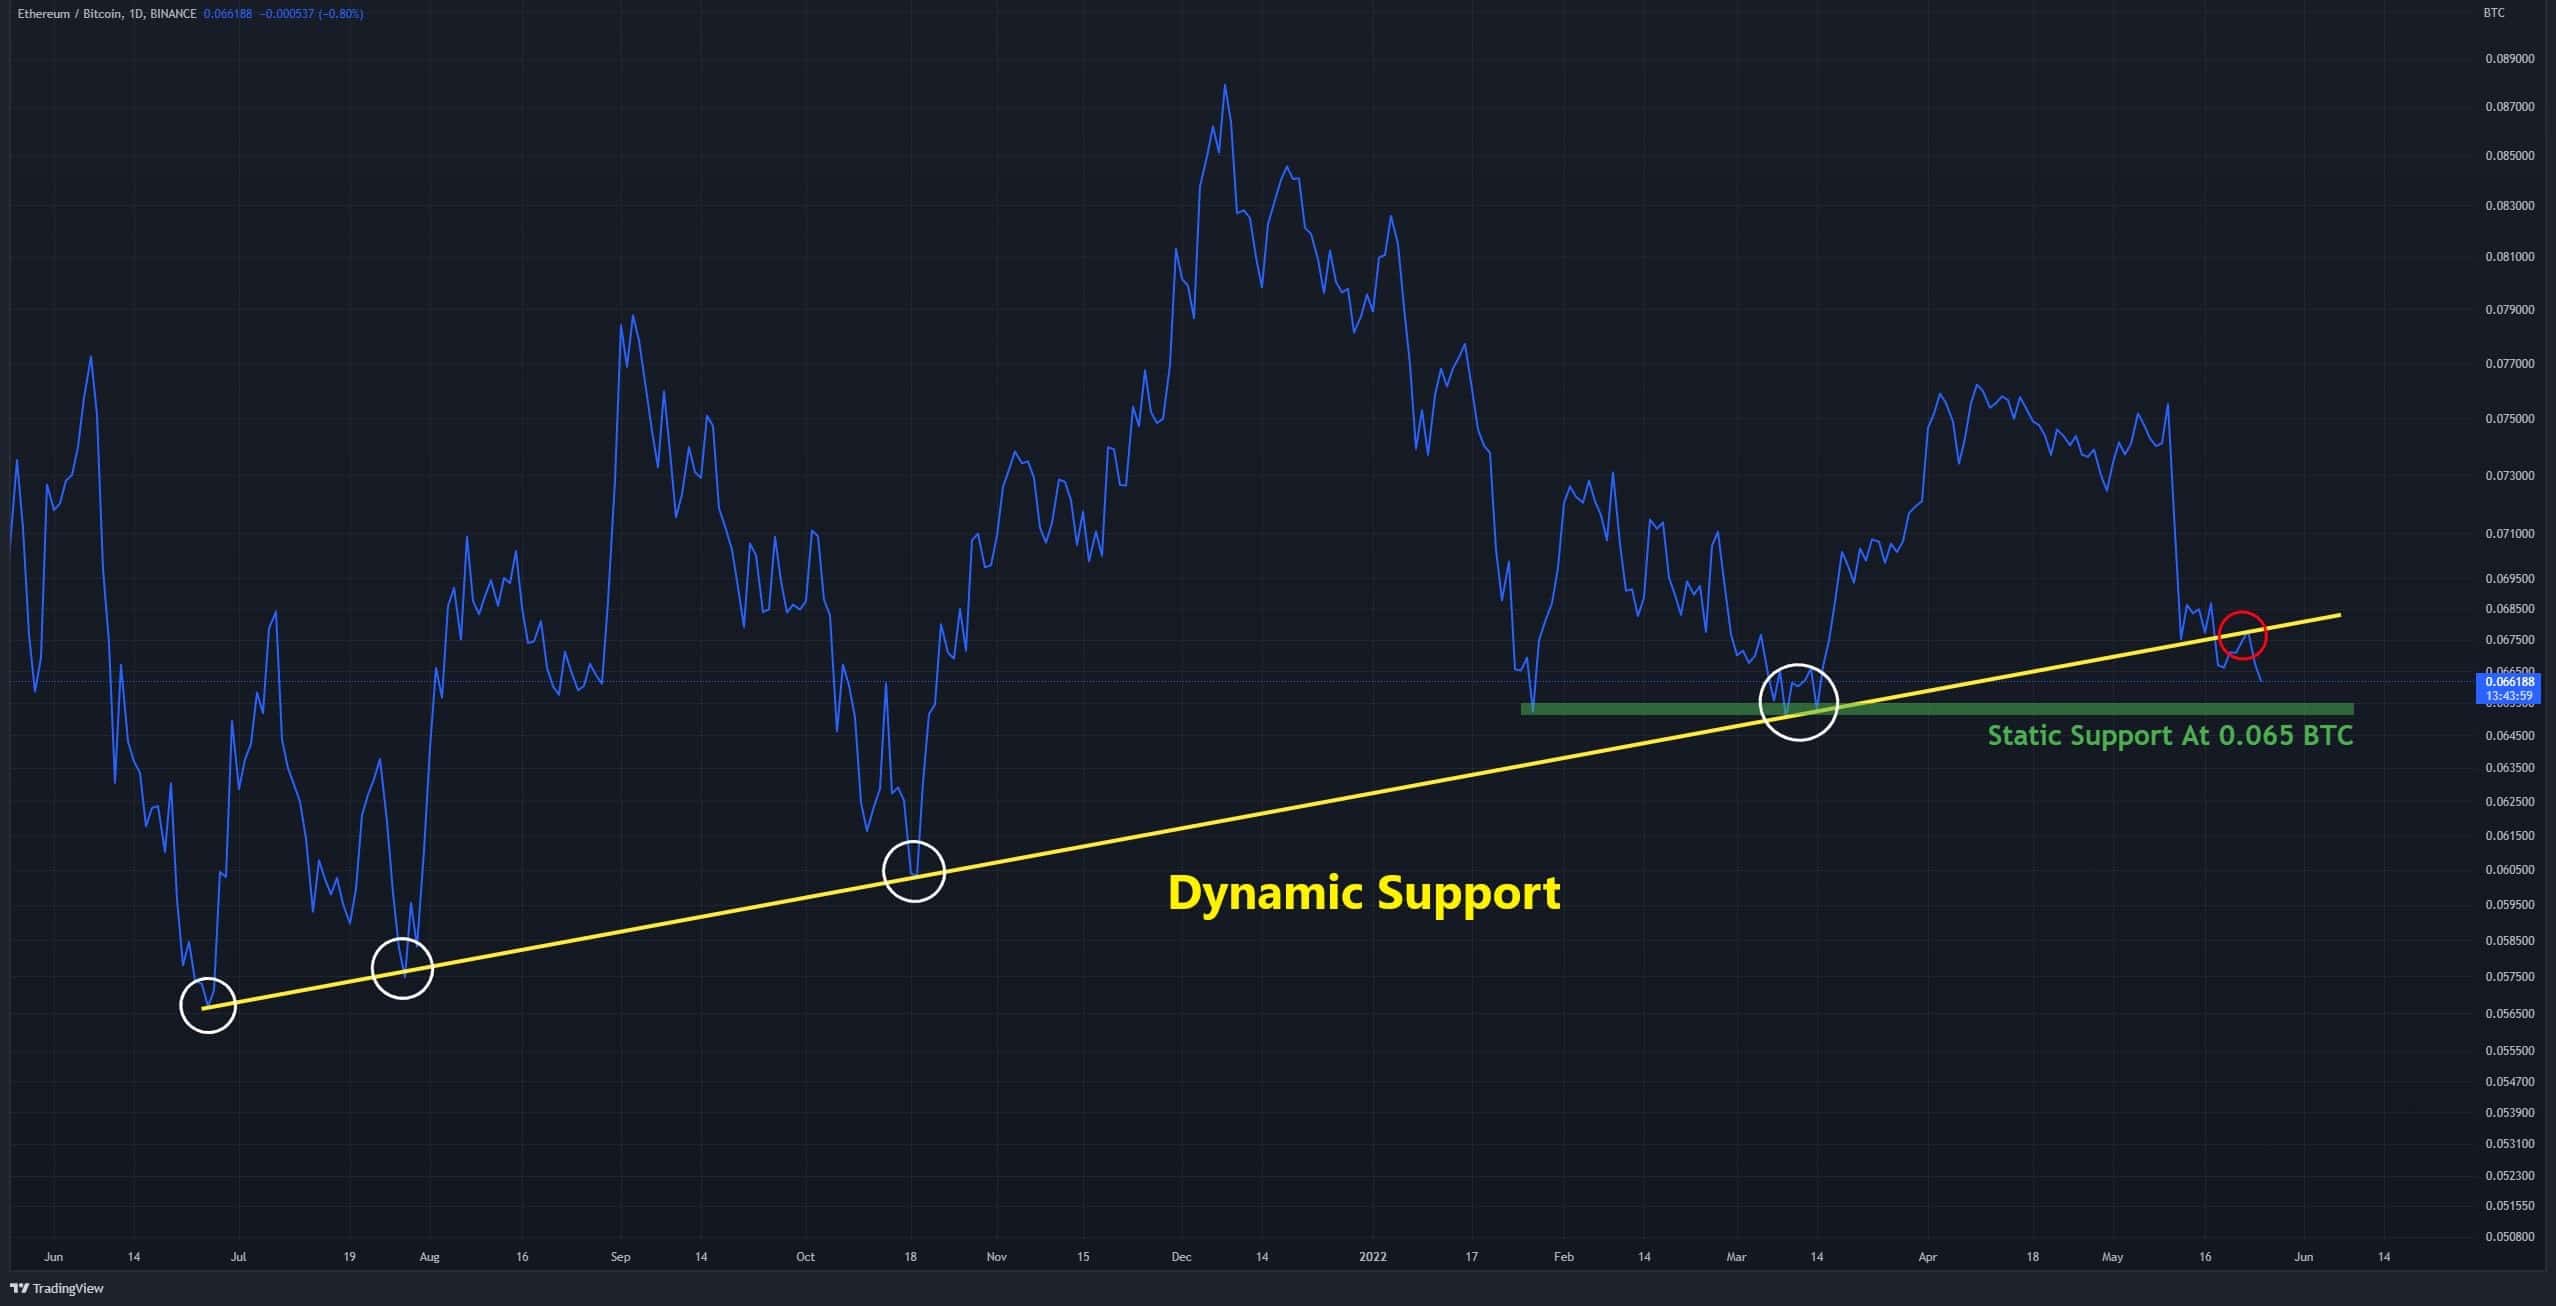
The ETH/BTC Chart
As seen in the chart below, the price has lost dynamic support (in yellow) against Bitcoin, and even on the retest, the bulls were unable to push it above the trend line.
This suggests that the downtrend is strong. However, the most significant level remains the static support (in green) that the bulls have so far defended twice. Ethereum and altcoins are likely to experience a sharper drop if the sellers successfully push the price down to the green level. In that case, ETH may reach $1500 and even $1300.
Key Support Levels: 0.065 BTC & 0.06 BTC
Key Resistance Levels: 0.07 BTC & 0.072 BTC