Following a disappointing performance of US stocks yesterday, the crypto market has also kind of stagnated. The bulls do not seem to have regained their strength, and the bears remain in control.
Technical Analysis
By Grizzly
The Daily Chart
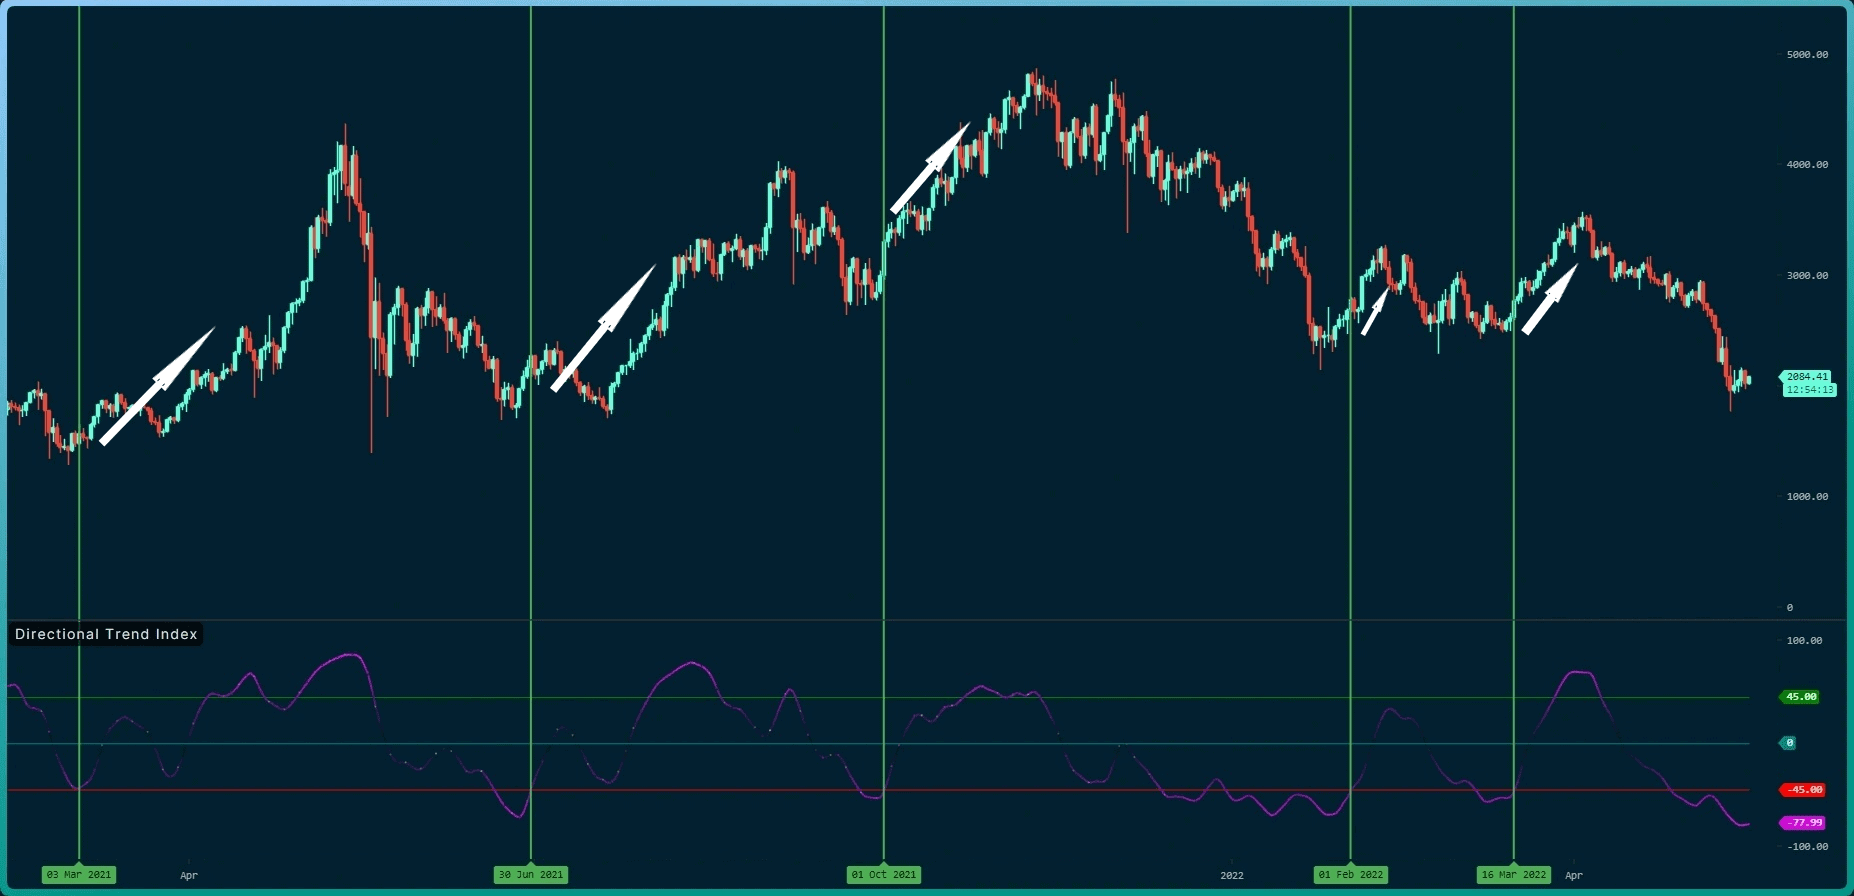
Ethereum does not appear to have enough strength to start an upward trend on the daily timeframe. Thus far, every upward movement has been stopped by the bears.
The chart below shows five upward trends using the Directional Trend Index in purple over the last year. The red line in the chart indicates the level where all five uptrends started after crossing above it. If this index moves below the red line, it shows weakness in the trend and a possible further drop in price.
Currently, this index has fallen to its lowest level in a year. As a result, it’s hard to interpret it as positive momentum in the market.
Key Support Levels: $1700 & $1500
Key Resistance Levels: $2200 & $2450
Moving Averages:
MA20: $2570
MA50: $2877
MA100: $2859
MA200: $3325
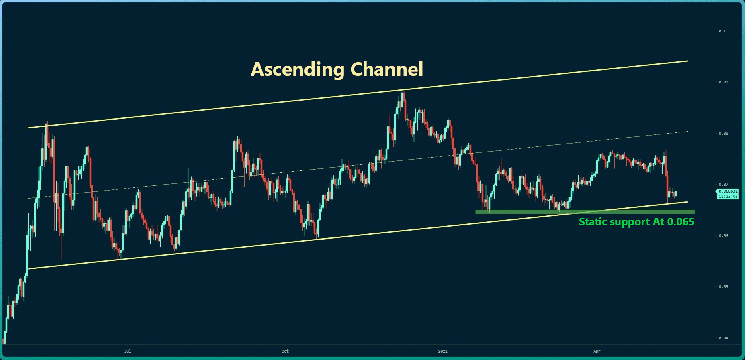
The ETH/BTC Chart:
The price of the BTC pair moves upwards within an ascending channel (in yellow). However, the uptrend in 2022 has weakened gradually.
Currently, the price is at the bottom of the channel and can remain bullish if it does not lose support, even if it drops below the static level at 0.065.
Suppose the bears successfully lowered the price below the green support zone. In that case, a trend reversal signal will be issued, and we will need to wait for lower levels.
Key Support Levels: 0.065 BTC & 0.06 BTC
Key Resistance Levels: 0.07 BTC & 0.072 BTC
On-Chain Analysis
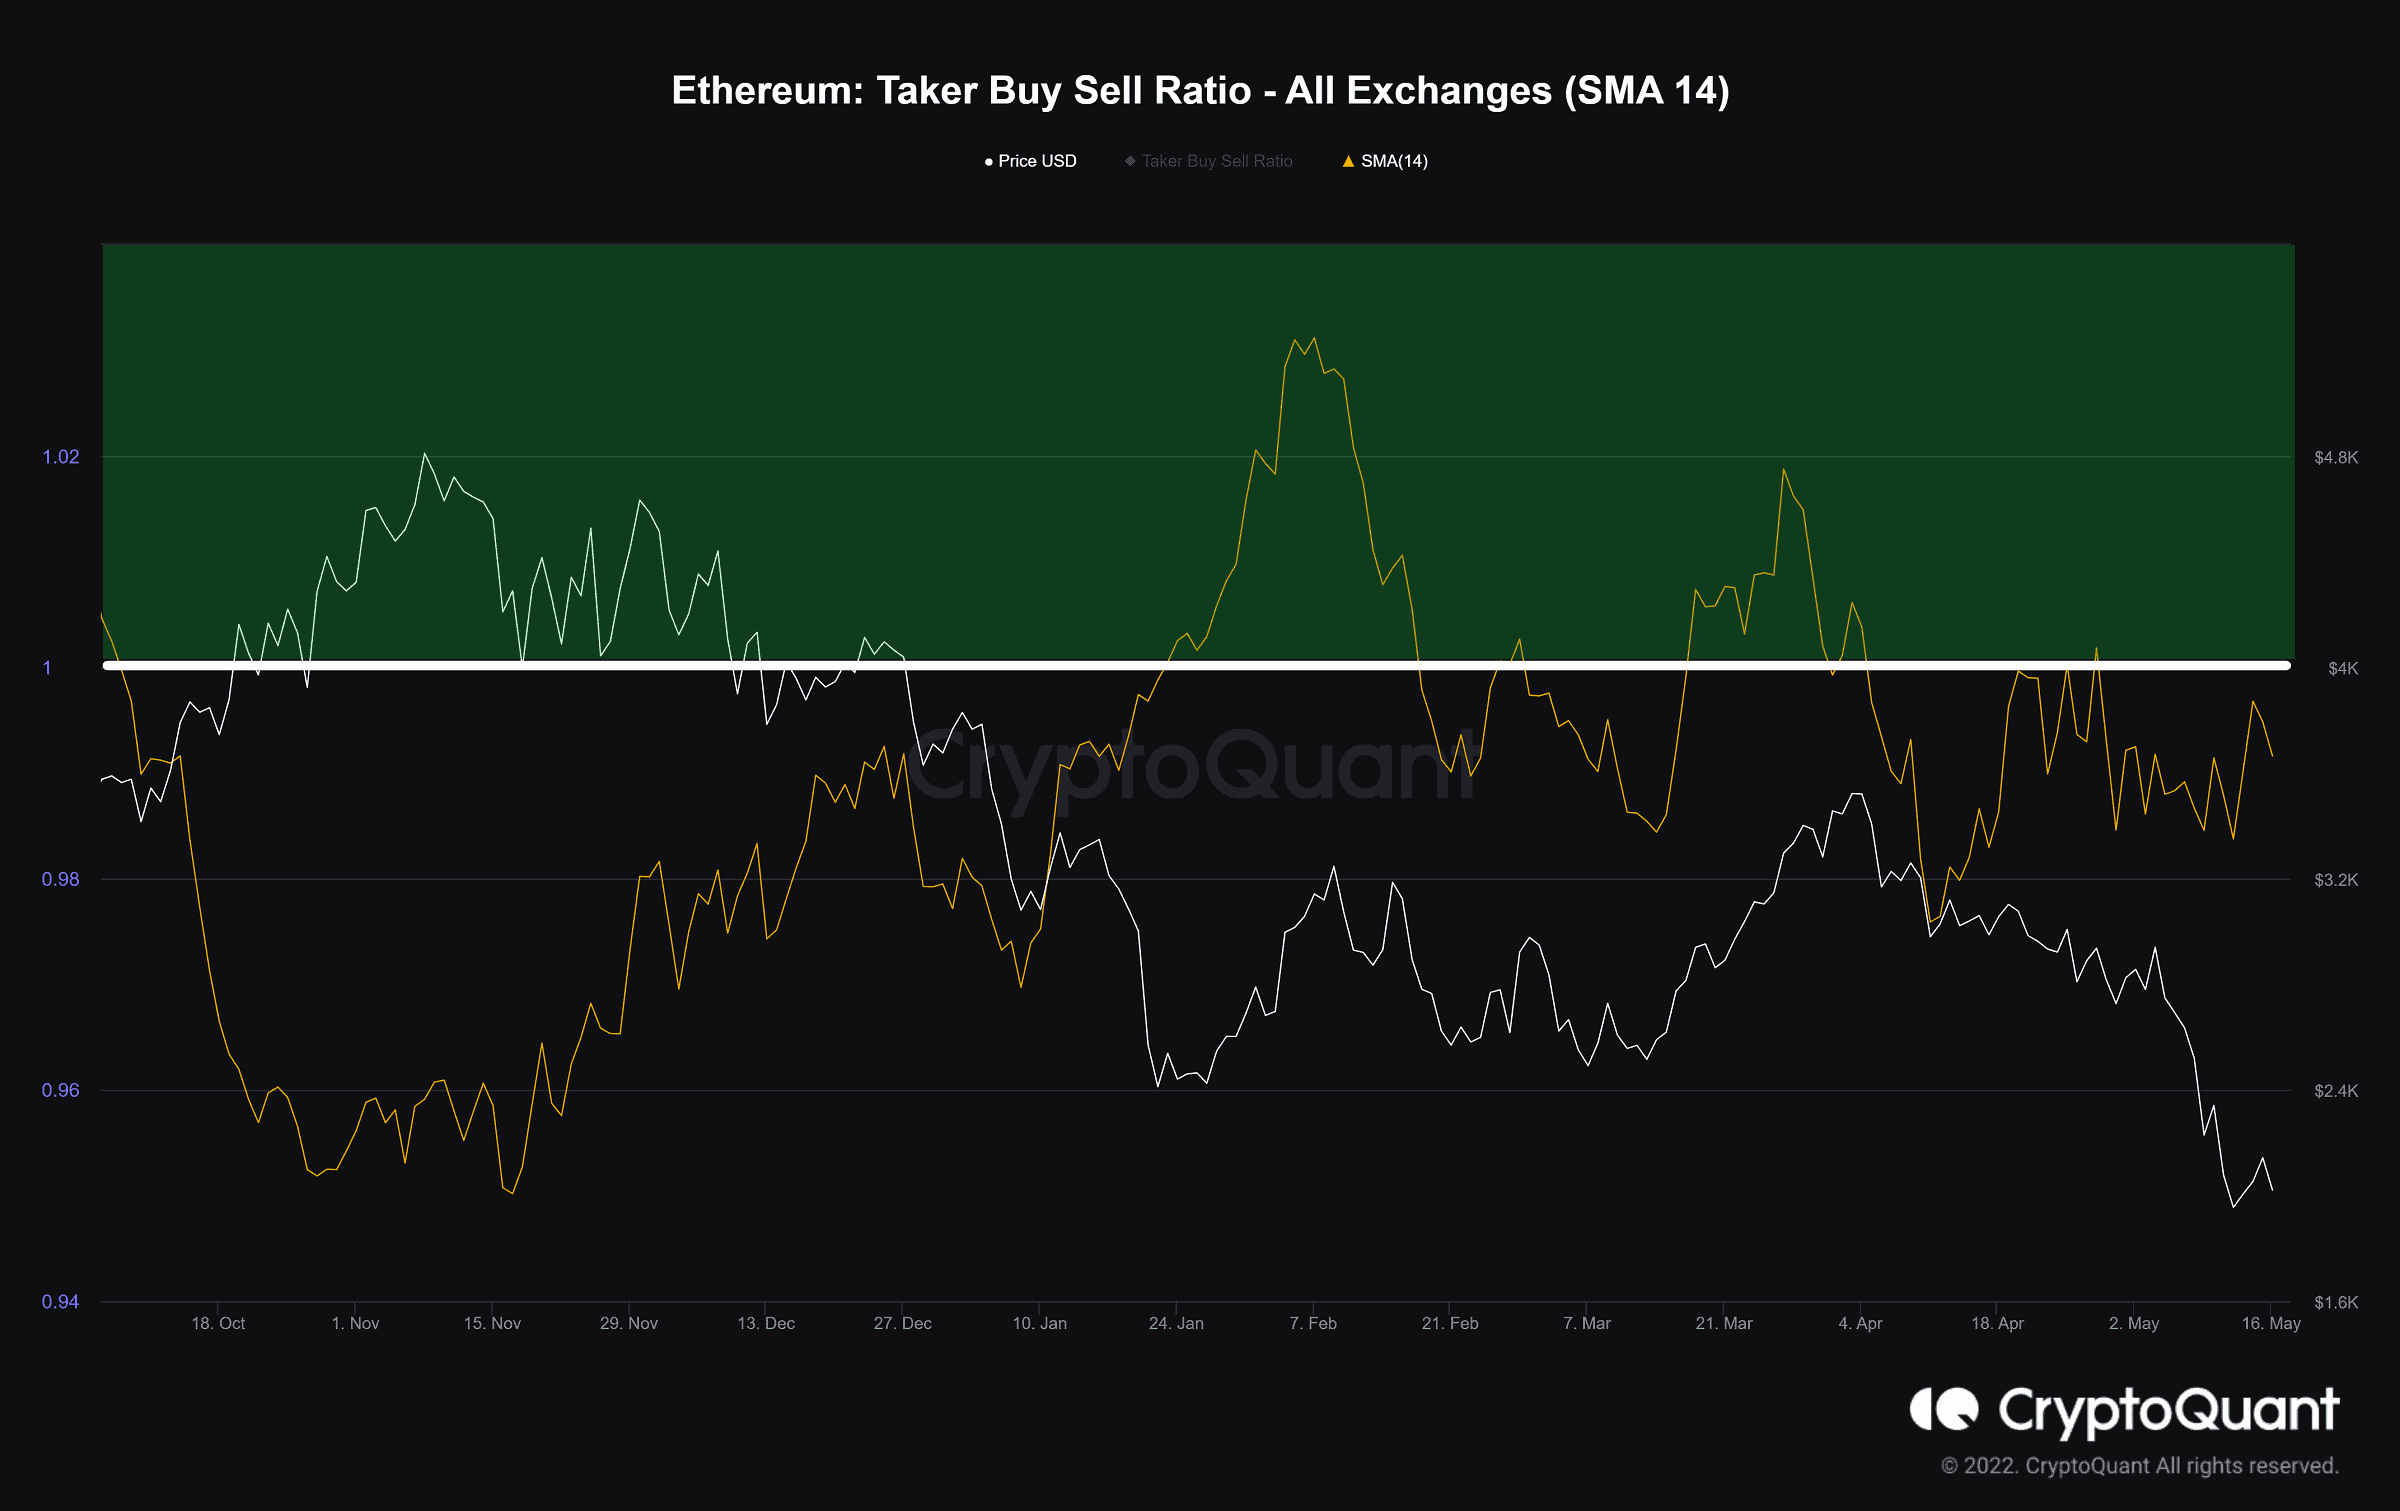
Taker Buy Sell Ratio
Definition: The ratio of buy volume divided by sell volume of takers in perpetual swap trades. Values over 1 indicate bullish sentiment is dominant. Values under 1 indicate bearish sentiment is dominant.
As noted in the analysis above, there is still not much momentum for the bulls to sustain price recovery. Furthermore, the chart demonstrates that the seller takers are still in the lead. This index has increased slightly in the last two days, indicating that sellers are still in control of the market, and this will persist as long as it remains below one.