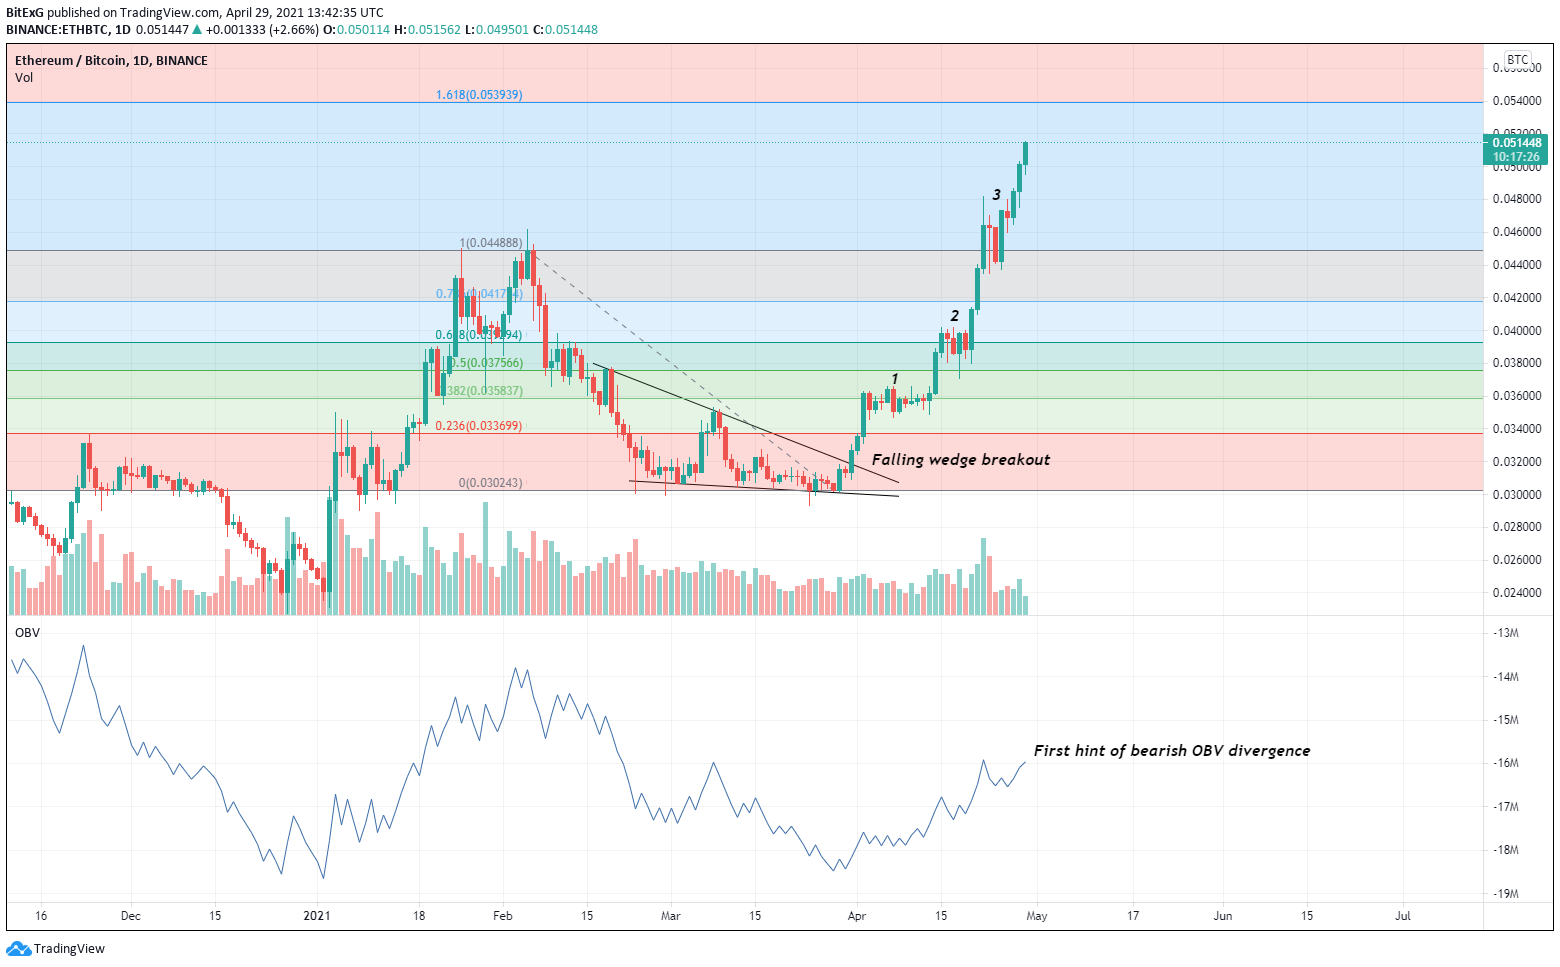
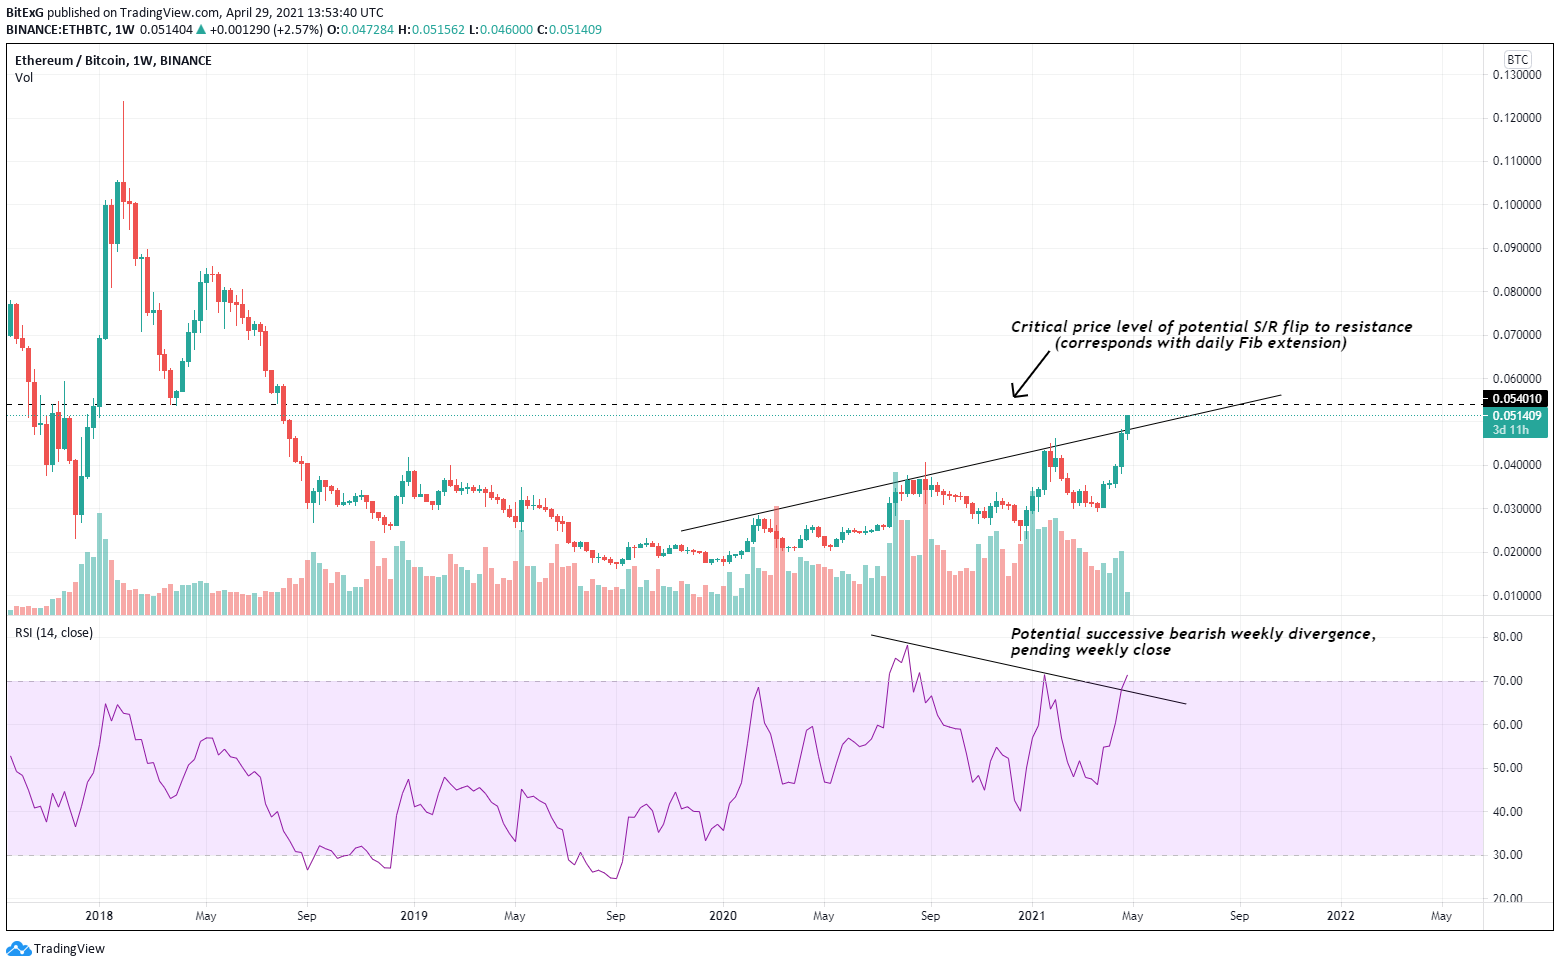
Exactly a month ago to the day, Ethereum (ETH) was seemingly languishing in the shadows of not only Bitcoin (BTC) but lesser lights such as Cardano (ADA) and Binance coin (BNB), which were being touted as legitimate contenders to the throne of the leading altcoin as Ethereum grappled with inefficiencies on both network and development fronts. What a difference a month makes? After retaining the critically important support level of 0.03 BTC in March, ETHBTC has risen 57% for the month of April. Spurred on by Ethereum core developers defusing a miner revolt against EIP-1559 by acceding to a counter-proposal, EIP-3368, which would increase block reward to 3 ETH per block pro tem, until the network fully transitions to proof-of-stake, and other optimistic layer 2 protocol developments (pun intended), April could now represent the 2nd largest monthly gain for Ethereum against Bitcoin, next only to January 2018. So how high can ETHBTC go? Are we on the brink of a full-blown alt season? It cannot be overstated just how important it was for ETHBTC to hold on to 0.03 BTC. While testing the support level three times in March, the pair established a falling wedge pattern (charted below) and successfully secured a breakout in the first week of April.  Since then, we’ve seen 2 vertical rallies and consequent consolidations, with the third currently in progress. For the first time, there’s a hint of bearish On-balance volume (OBV) divergence as ETHBTC approaches the Fibonacci extension level of 0.0539. Parabolic moves typically consist of 3 legs up before they break down. Whether ETHBTC can further sustain this momentum depends on being able to overcome the 1.618 Fibonacci extension. The weekly chart below also points to a knick point for ETHBTC. Besides successive weekly RSI divergences, it highlights the historical significance as a potential support to resistance flip of 0.054. Note that the most recent candle represents the current weekly session which is more than 3 days from closing. Divergence is charted for the last closed session.
  Market Summary
- Key support levels - 0.05 BTC, 0.048 BTC
- Key resistance levels - 0.054 BTC, 0.068 BTC
- Market outlook - Cautiously bullish
 bitcoinexchangeguide.com