Ethereum, like most of its peers, has incurred a slight amount of selling pressure today that has led it to decline from highs of just under $200 that were set yesterday. This tempered move lower comes as the crypto is caught within a firm mid-term uptrend.
It does appear that this uptrend may be short-lived, however, as analysts are now widely pointing to the existence of a massive rising wedge pattern that it is currently caught within, as a bearish resolution to this pattern could lead to significant losses.
This also coincides with bearishness flashed by ETH against its Bitcoin trading pair, and the confluence of its weakness across its two major trading pairs signals downside is imminent.
Ethereum Drifts Lower as Weakness Against Bitcoin Grows
At the time of writing, Ethereum is trading down over 1% at its current price of $193.70, marking a slight decline from daily highs of nearly $200 that were set yesterday.
ETH is also showing some weakness against its Bitcoin trading pair, currently trading down over 2% as the benchmark crypto remains stable just below its daily highs of $7,800.
Analysts are now noting that they anticipate Ethereum to show further weakness against its Bitcoin trading pair, as the resistance that exists just above its current price at 0.026 BTC may be enough to catalyze a significant decline.
One trader mused this possibility in a recent tweet, pointing to this resistance in a chart while offering a near-term downside target at roughly 0.0235 BTC.
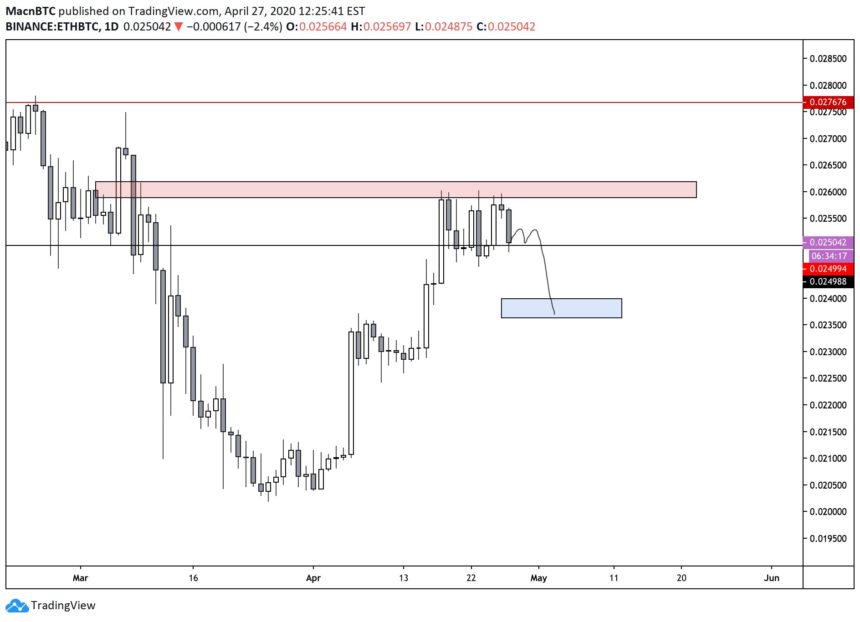
Image Courtesy of Mac
He related this chart to a previous tweet of his in which he noted that he anticipated Bitcoin to outperform the aggregated market in the near-term, leading cryptocurrencies like Ethereum to see some weakness.
ETH Establishes Highly Bearish Technical Pattern that Could Lead to Serious Losses
This isn’t the only factor currently counting against Ethereum’s favor, as it also recently formed a highly bearish technical formation that could lead significantly lower against USD.
Analysts have been widely pointing to this rising wedge pattern over the past few hours, with one offering a chart showing a near-term downside target at roughly $160 if it posts a confirmed breakdown of this pattern.
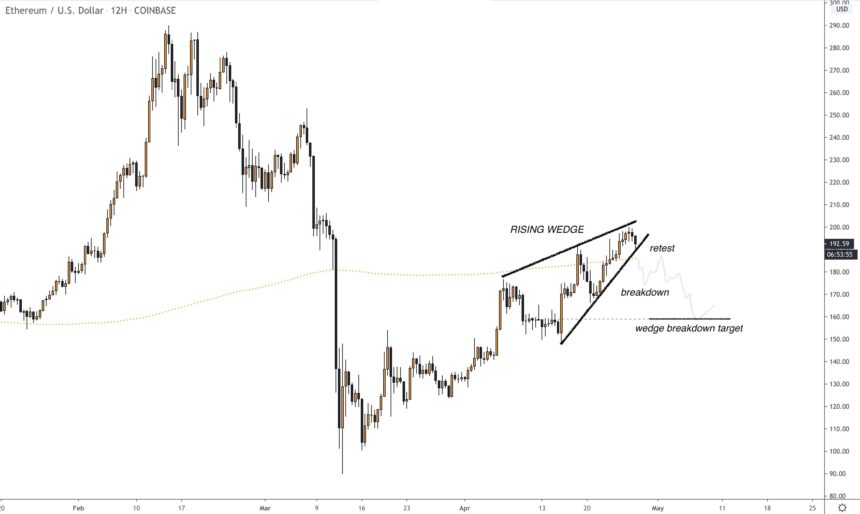
Image Courtesy of CryptoBirb
Because of ETH’s weakness against BTC, it is a strong possibility that this movement will come about independent of Bitcoin seeing any downside.
It is also possible, however, that this present technical weakness will be magnified if BTC is rejected at $7,800.
Featured image from Unplash.