Ethereum has been very stagnant this past week, moving only by a small 0.3%. The cryptocurrency now trades at a price of $189. Ethereum has been trapped within a short term consolidation pattern because of which it only increased by a small 4% over the past 30 days.
Ethereum remains the second-largest cryptocurrency as it holds a market cap of $20.28 billion.
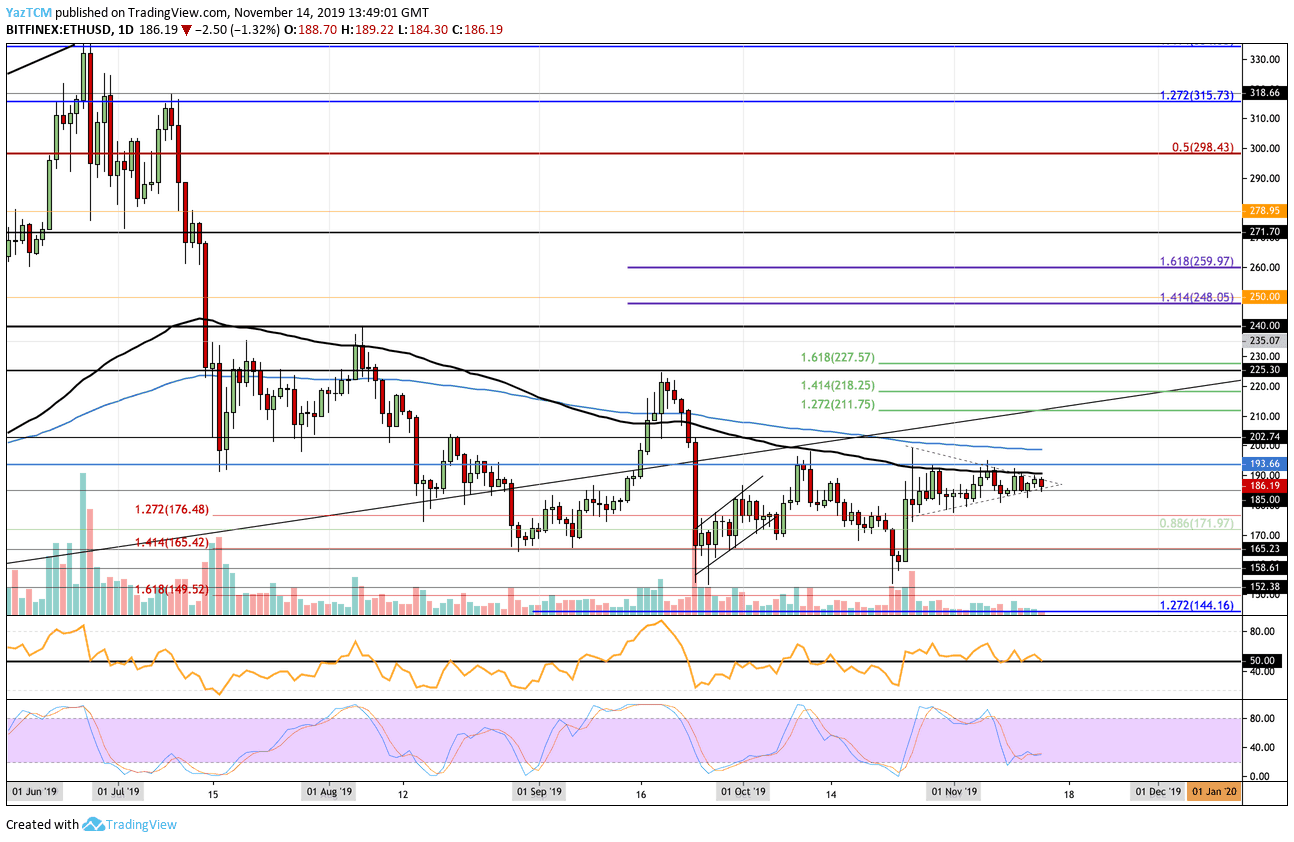
Looking at the ETH/USD 1-day chart:
- Since our previous ETH/USD analysis, the cryptocurrency couldn’t break above the resistance at the 100-days EMA at around $190 as it established a short-term symmetrical triangle pattern. A break of this triangle will dictate which direction ETH would likely head towards next.
- From above: The nearest level of resistance lies at the 100-days EMA and the upper boundary of the symmetrical triangle. Above this, resistance stands at $194 and $200. The resistance at $200 is bolstered by the 200-days EMA. Higher resistance is found at $202, $211, $218, $225, and $227.
- From below: The nearest level of support lies at the lower boundary of the symmetrical triangle at around $185. Beneath this, support can be expected at $176, $172, $170, and $165.
- The trading volume remains very low as it decreases from the average October volume.
- The RSI is trading at the 50 level which is characterized by the current period of consolidation. However, the Stochastic RSI is in oversold conditions as we wait for a bullish crossover signal to send us higher.
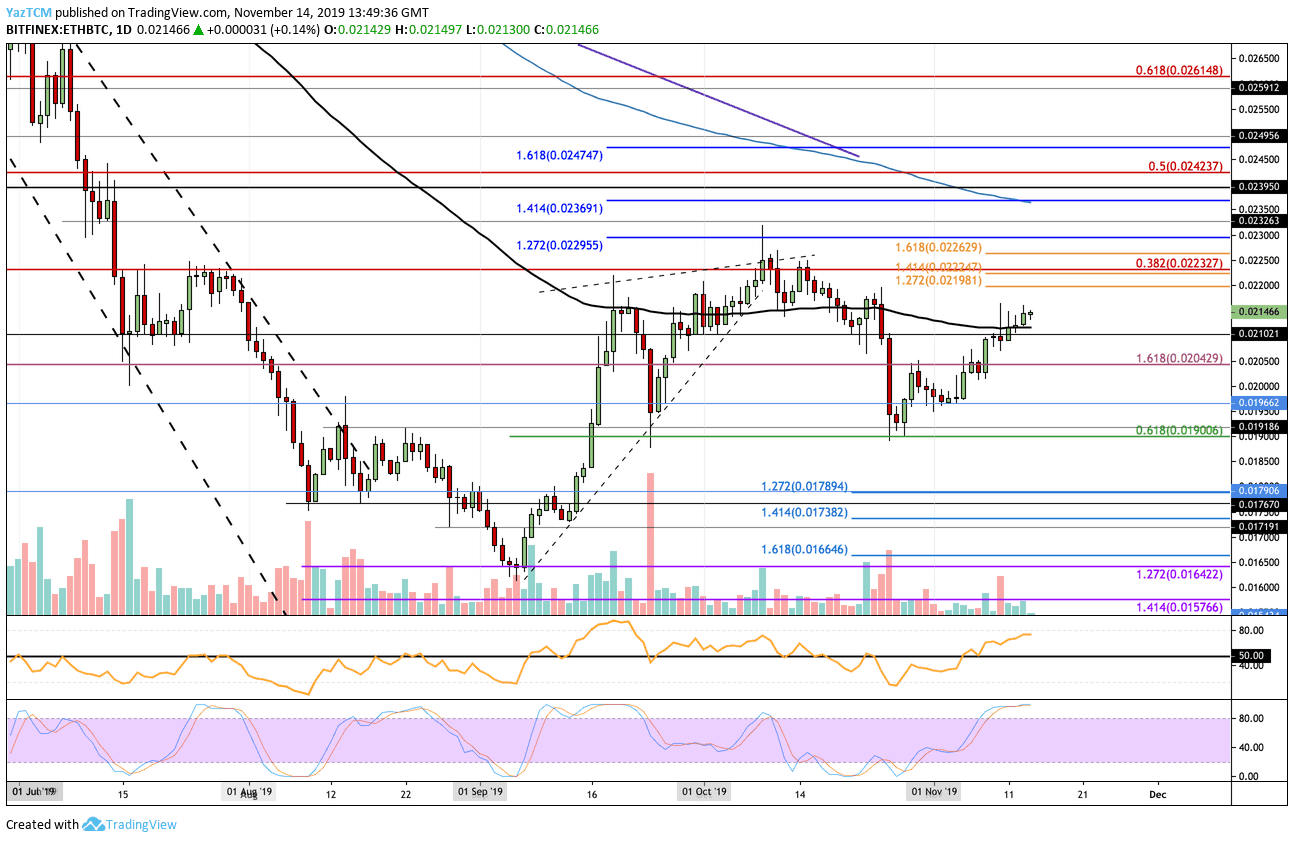
Looking at the ETH/BTC 1-day chart:
- Against BTC, ETH climbed above the previous resistance at the 100-days EMA as it currently trades higher at around 0.021466 BTC.
- From above: The nearest level of resistance lies at 0.0215 BTC. Above this, resistance is found at 0.02198 (1.272 Fib Extension), 0.02232 BTC (bearish .382 Fib Retracement), and 0.02262 BTC. Higher resistance is expected at 0.023 BTC, 0.02326 BTC, 0.02369 BTC (200-days EMA), and 0.02390 BTC.
- From below: The nearest level of support lies at the 100-days EMA and the 0.021 BTC level. Beneath this, support stands at 0.0204 BTC, 0.020 BTC, 0.01966 BTC, and 0.019 BTC (.618 Fib Retracement).
- The trading volume remains very low in this market.
- The RSI is above the 50 level which shows that the bulls dominate the market momentum. However, the Stochastic RSI is in overbought conditions, warning traders to remain cautious, as a bearish crossover signal would send the market lower.