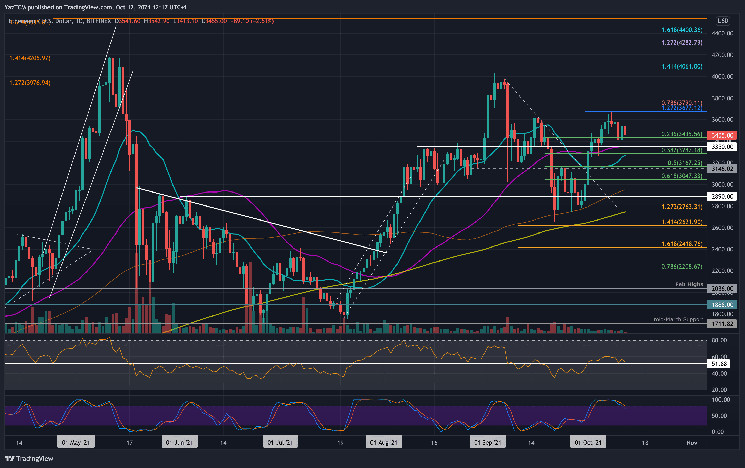
ETH/USD – Ether Still Needs To Close Above $3600
Key Support Levels: $3400, $3350, $3287.
Key Resistance Levels: $3600, $3677, $3790.
Etheruem fell a small 2.5% today towards the $3400 support. Ethereum rebounded from $2800 at the end of September and started to go higher. By the end of last week, ETH had managed to reach $3677.
More specifically, ETH could not close a daily candle above the resistance at $3600 and ended up rolling over from there to find the support at $3400 on Sunday. It has now established a short-term range between $3600 and $3400 and must break out to dictate the next direction.
ETH-USD Short Term Price Prediction
Looking ahead, the first resistance lies at $3600. This is followed by $3677 (October highs), $3790 (Bearish .786 Fib), and $4000.
On the other side, the first support lies at $3400. This is followed by $3350 (50-day MA), $3287 (.382 Fib & 20-day MA), $3167 (.5 Fib), and $3000.
The daily RSI remains above the midline but is struggling to gain ground further above it. This suggests indecision within the market as it trades inside the established range.
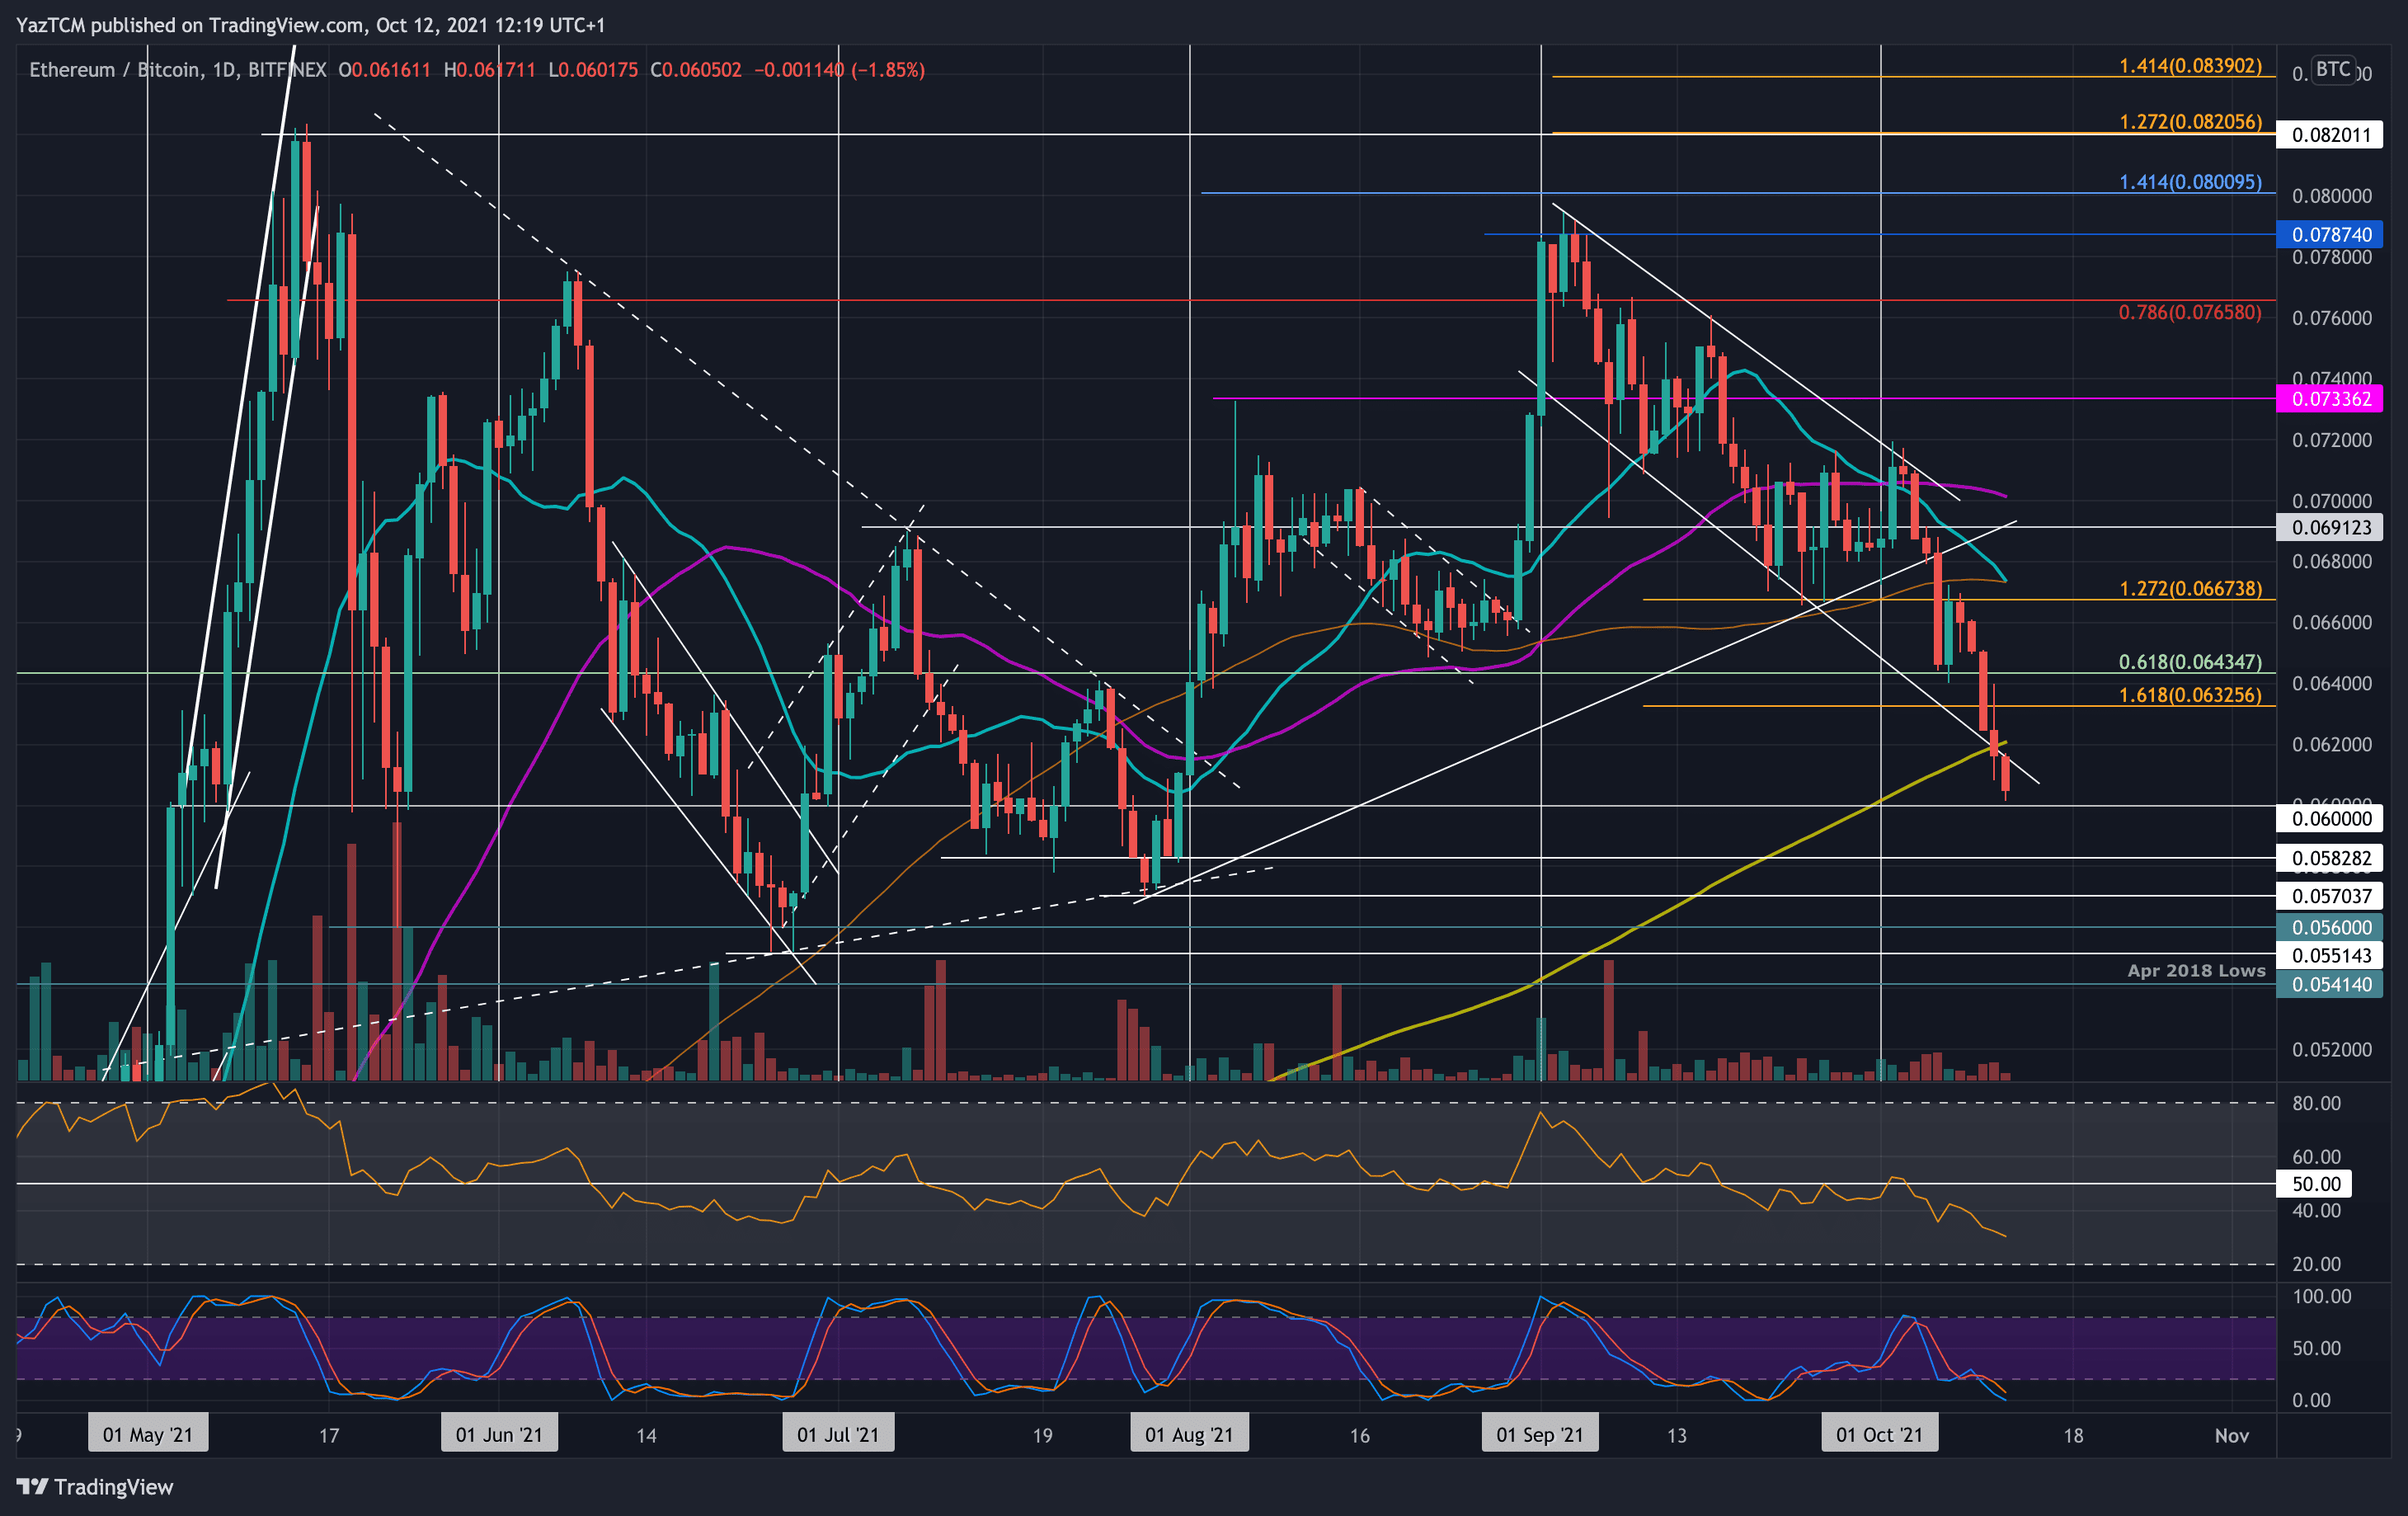
ETH/BTC – Bears Push Beneath 200-day MA.
Key Support Levels: 0.06 BTC, 0.0582 BTC, 0.057 BTC.
Key Resistance Levels: 0.062 BTC, 0.0632 BTC, 0.0643 BTC.
Ethereum has been struggling tremendously since the start of September when it rolled over from resistance at 0.0787 BTC. Since then, ETH has dropped by a total of almost 24% to reach the 0.06 BTC level today.
Ethereum started October by falling from 0.072 BTC to find support at 0.0643 BTC (.618 Fib). The support at 0.0643 BTC was penetrated on Sunday, and ETH continued beneath the 200-day MA yesterday to hit 0.06 BTC today.
ETH-BTC Short Term Price Prediction
Moving forward, the first support lies at 0.06 BTC. This is followed by 0.0582 BTC, 0.057 BTC, 50.056 BTC, and 0.0551 BTC (April 2018 lows).
On the other side, the first resistance lies at 0.062 BTC (200-day MA). This is followed by 0.0632 BTC, 0.0643 BTC, 0.066 BTC, and 0.067 BTC (100-day MA).
As expected, the daily RSI is well beneath the midline, indicating that the bears are in total control of the market momentum.