Ethereum’s valuation thrived during the early May bull run and the coin’s valuation breached the $200 dollar mark. ETH consolidated comfortably in the higher range of $230-$280 before breaching the $300 dollar mark on 21st June. The valuation took a beating after bullish momentum receded and the coin was restricted under $230 after a massive fall was witnessed on 11th July.
12-hour chart
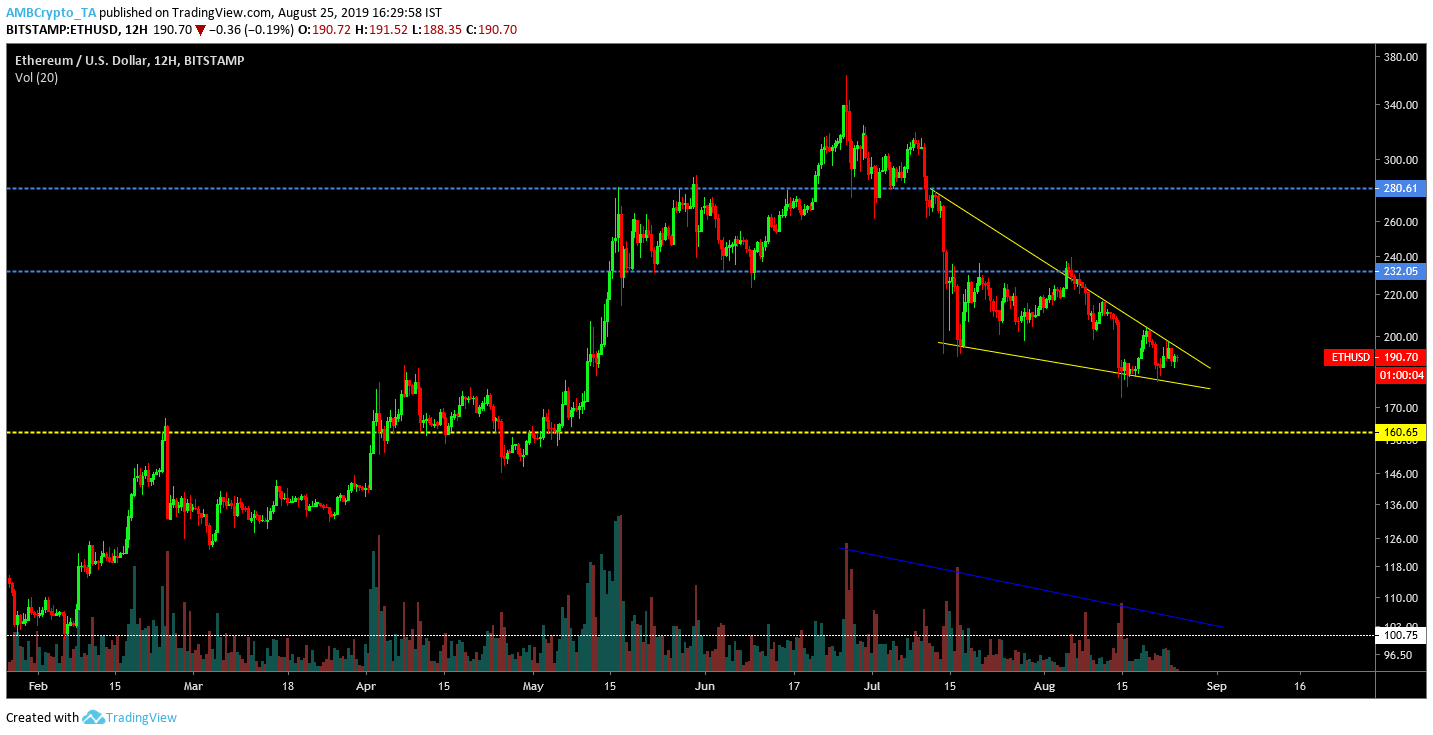
Source: Trading View
The 12-hour chart of Ethereum indicated that the price has been downward for the past month. Though ETH was valued at $190.98 at press time, current price movement indicated formation of a falling wedge pattern. A couple of lower highs and lower lows were formed in the pattern which signals that a positive breakout is underway. Declining trade volume also confirmed the forming pattern; thus trend lines are expected to reverse and seek higher ground on the charts.
In case of a positive breakout, ETH’s price should retest immediate resistance at $232.05. On the contrary, if a negative breakout transpires despite bullish indications, valuation could take another hit which might take the price further down to $160.
6-hour chart
Source: Trading View
The 6-hour chart of Ethereum showed a similar falling wedge pattern as observed in the 12-hour chart. The price treaded close to support at $169.64. However, MACD line indicated a bullish trend and Relative Strength Index or RSI line was neutral.
Conclusion
Formation of a prominent falling wedge on 6-hour and 12-hour charts can be assumed as positive signs for the coin. This hypothesis can be supported by a decline in bearish momentum as well.