Ethereum’s cryptocurrency, ether, is losing altitude, with signs suggesting the asset has ended a bull market from December lows with a drop below $200 last week.
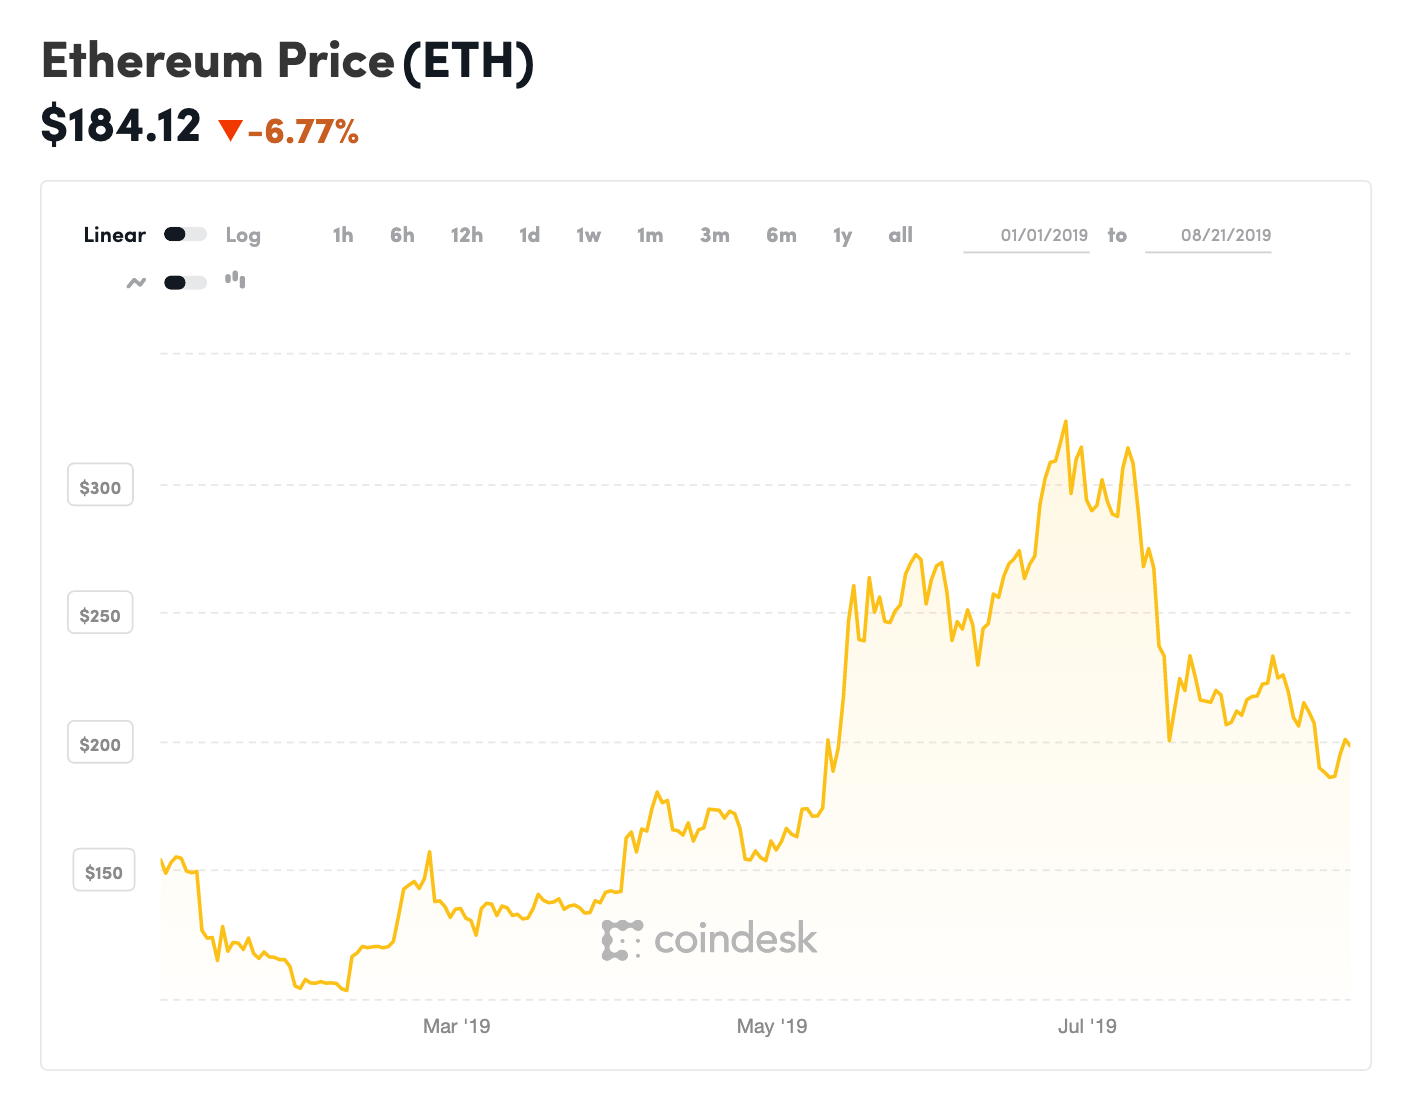 The price of ether since Jan. 1 via CoinDesk data.
The second-largest cryptocurrency by market capitalization is currently trading at $183 on Bitfinex, representing a 7.3 percent drop on a 24-hour basis. Prices fell 10.18 percent last week and closed (Sunday, UTC) at $194, the first under-$200 weekly close since mid-May.
More importantly, with the weekly close at $194, ether violated the uptrend from December lows as represented by the trendlines connecting December and February lows and December and May highs.
Essentially, the eight-month rising channel has been breached to the downside, a sign of bullish-to-bearish trend change, as per technical analysis theory.
So, the cryptocurrency could remain under pressure in the near-term, more so, as bitcoin, the top cryptocurrency, is looking south.
Weekly chart
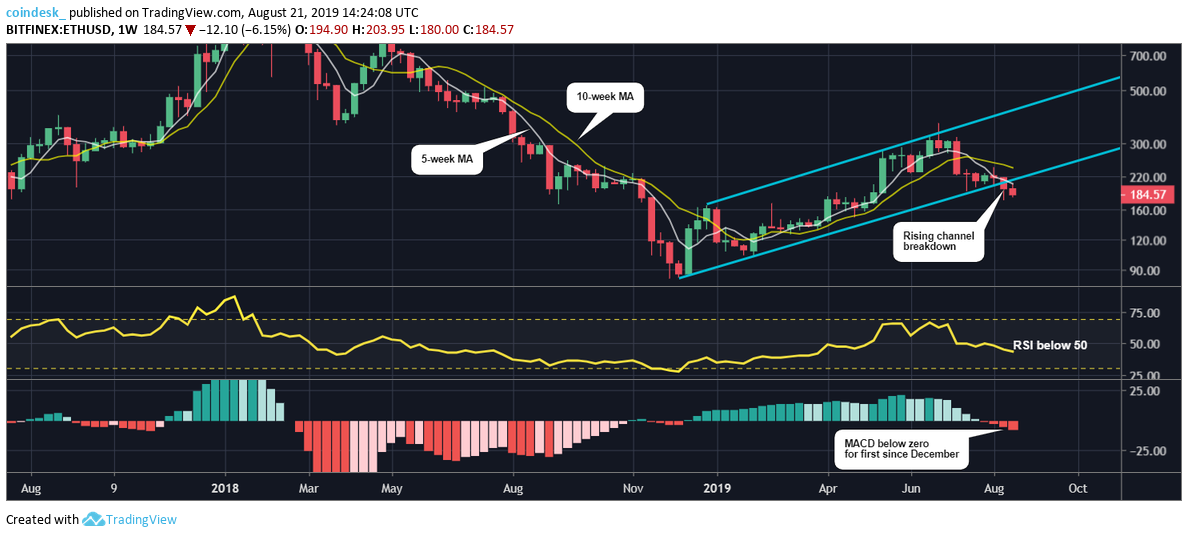
Ether bottomed out at $83.00 in mid-December, as the bitcoin bear market ran out of steam near $3,100.
The cryptocurrency then charted its first bullish higher low at $102.50 in the first week of February, before breaking into a bull market with a move above $167 in the first week of April.
Notably, prices rose by almost 57 percent in May – the biggest monthly rise since April 2018 – extended gains to hit a ten-month high of $363 at the end of June.
The cryptocurrency pulled back in July, but the correction did not damage the bullish structure.
However, the latest dip below $200 has violated the bullish higher lows and higher highs setup represented by the rising channel from December lows. Further, ETH made a failed attempt to retake the rising channel earlier this week, reinforcing the channel breakdown.
The downward sloping 5- and 10-week moving averages (MAs) also indicate a bearish setup.
Meanwhile, the 14-week relative strength index (RSI) has dropped into the bearish territory below 50 and the moving average convergence divergence has crossed below zero for the first time since December, confirming a bearish reversal.
So, support levels lined up at $170 and $150 could come into play in the near term.
Disclosure: The author holds no cryptocurrency assets at the time of writing.
Ethereum image via Shutterstock; charts by Trading View