Key highlights:
- Ethereum is down a sharp 5% today as the cryptocurrency falls back beneath $3,000
- The cryptocurrency is currently sitting at .5 Fib Retracement support as it trades inside a descending price channel
- Against Bitcoin itself, Ethereum is also trading inside a falling price channel as it battles to hold support at ₿0.068
| Ethereum price | $2,870 |
|---|---|
| Key ETH resistance levels | $3,000, $3,200, $3,300, $3,340, $3,400 |
| Key ETH support levels | $2,910, $2,800, $2,760, $2,678, $2,632 |
*Price at the time of publication
Ethereum is down a sharp 5% today as the cryptocurrency falls beneath the $3,000 level again. The cryptocurrency has been trading inside a descending price channel since the start of September and recently established support at $2,760 last week.
Since then, it has used the support as the lower boundary of the current range, with the upper boundary lying at around $3,100. Ethereum must break this week-long range to dictate the next direction for the market moving forward.
Ethereum remains the second-ranked cryptocurrency and currently holds a market cap value of around $358 billion.
Interestingly, the recent Chinese crypto crackdown is starting to have negative effects on the Ethereum network itself. The second-largest mining pool for Ethereum, Sparkpool announced that it would be halting access to new users from Mainland China. This pool is responsible for over 20% of the hash rate, and it has decided to close its doors by September 30th. In addition to this, the fourth-largest mining pool, BeePool, also announced that they would be closing their operations by October 15th.
It is unclear as to the effect of the network, but two large mining pools shutting down is likely to cause the hash rate for ETH to drop in the short term while miners re-locate.
Let us continue to take a look at the markets and see where they might be heading.
Ethereum price analysis
What has been going on?
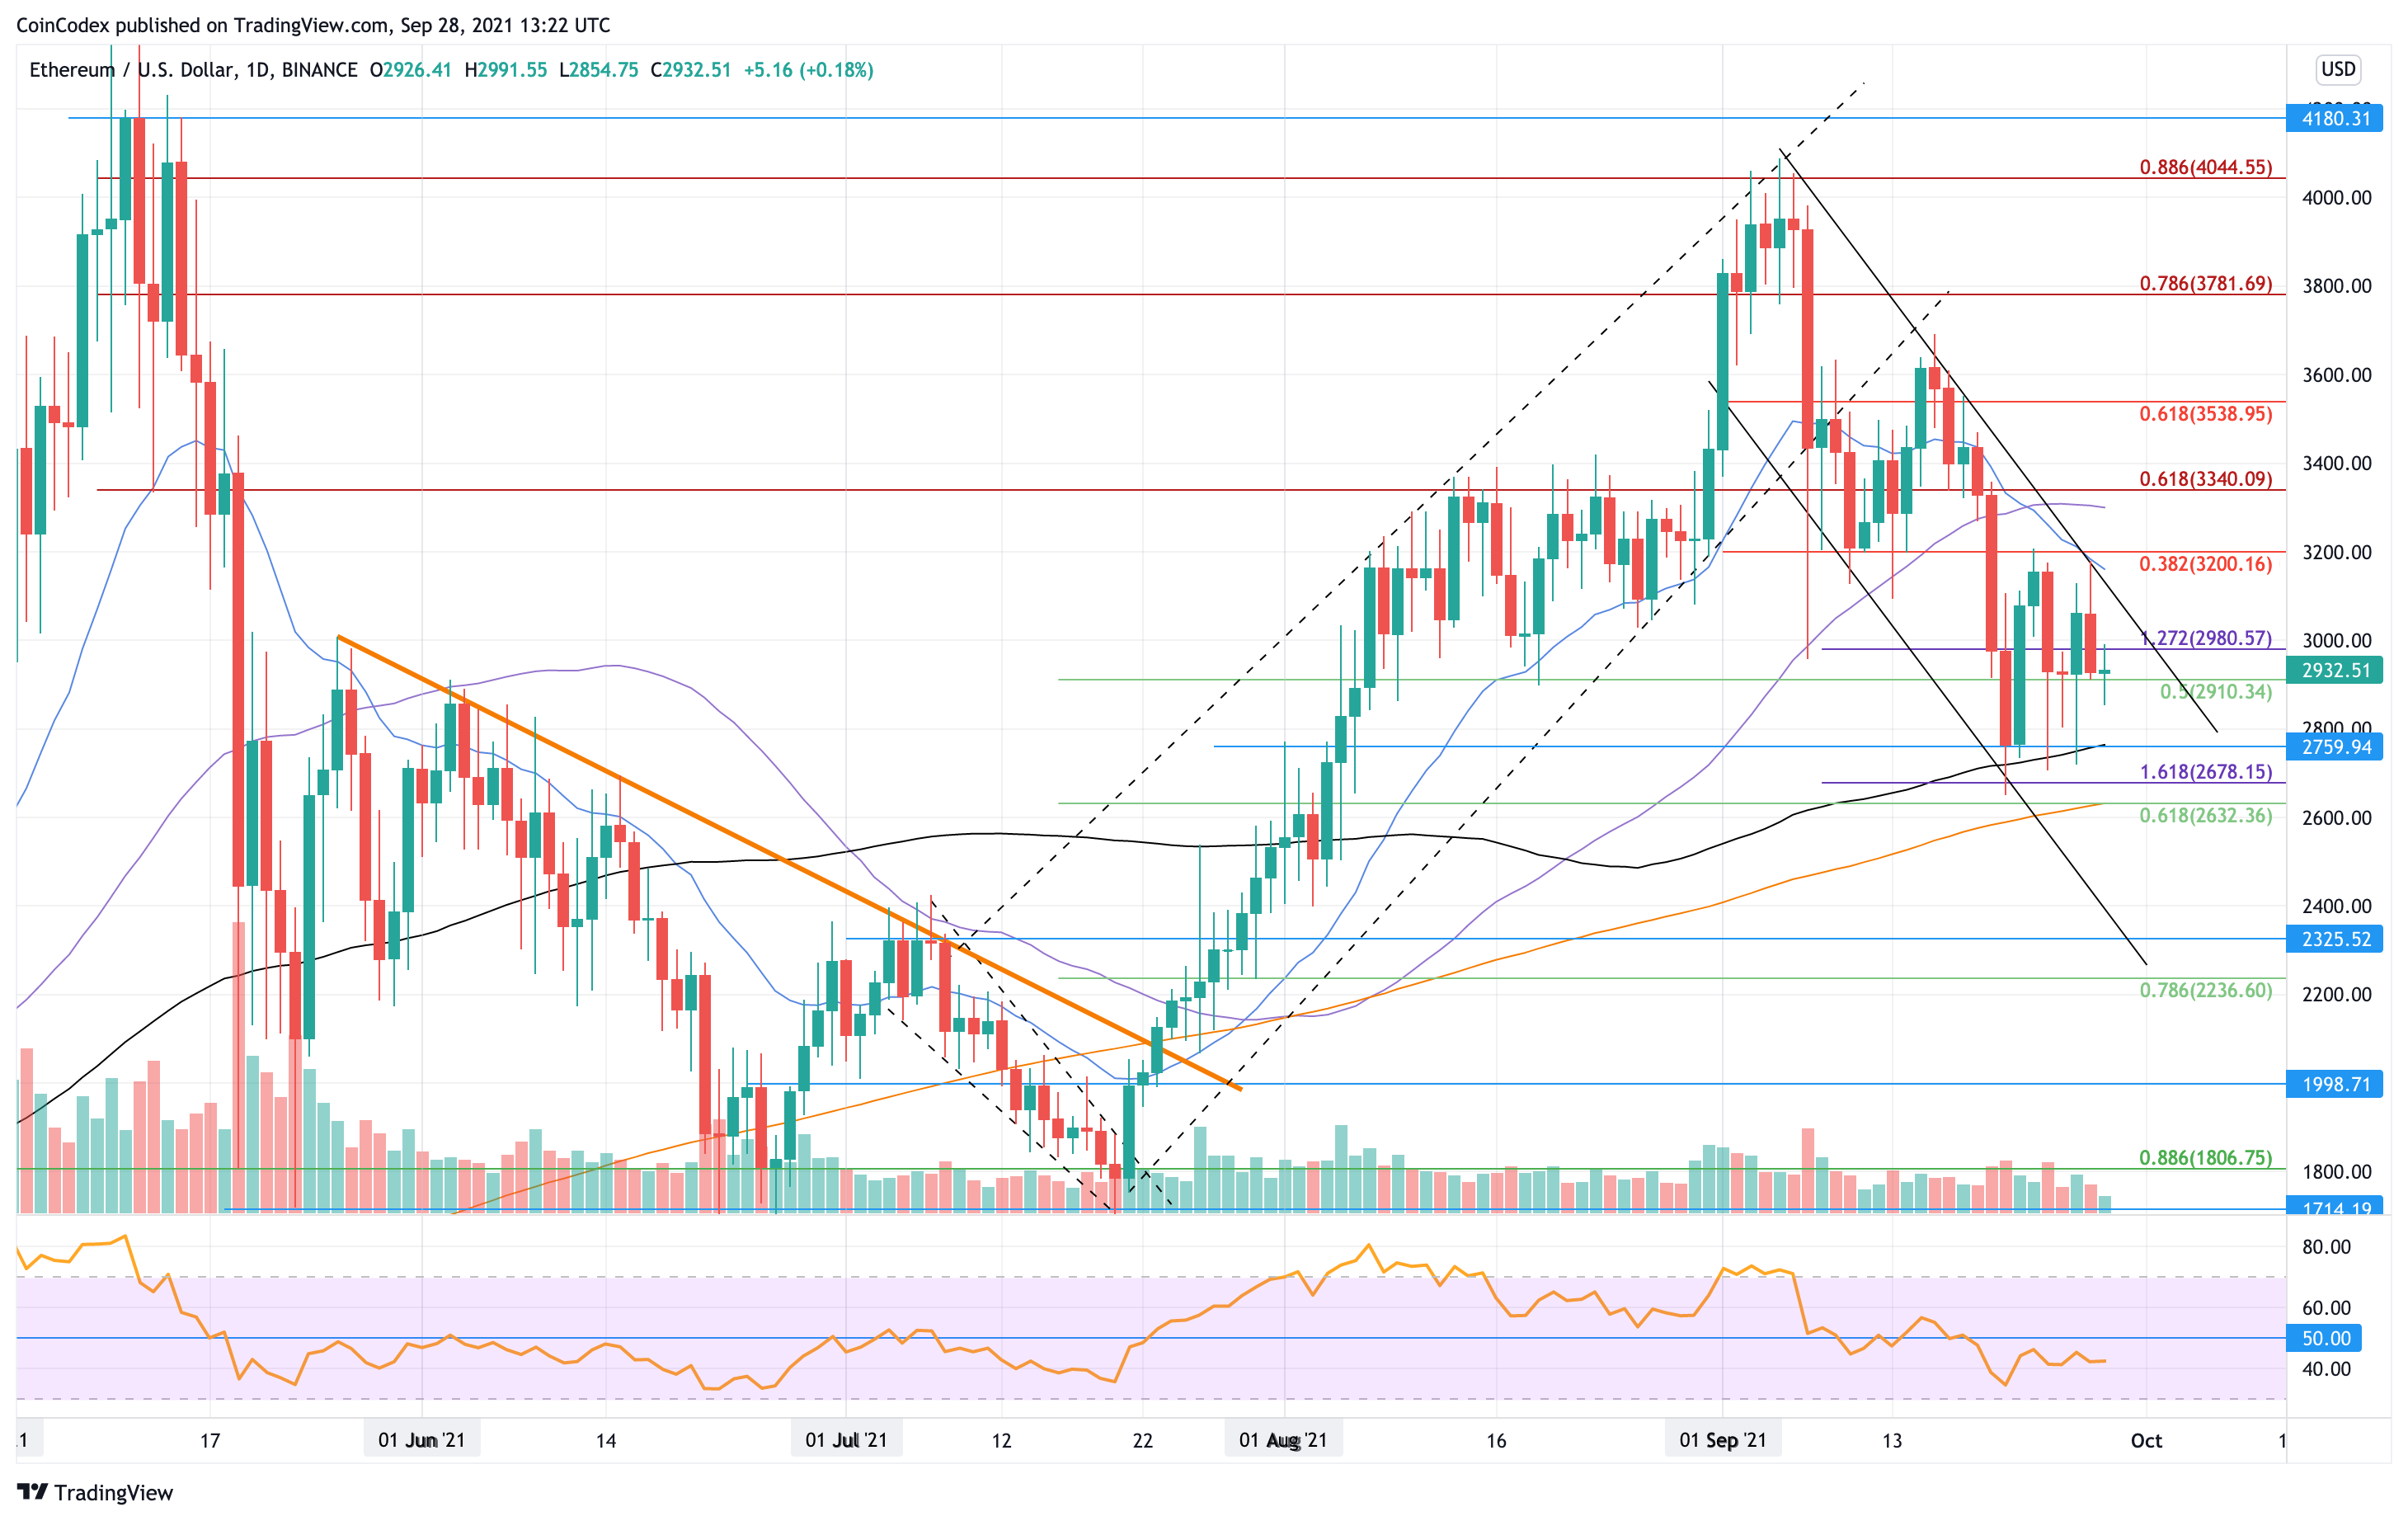
Looking at the daily chart above, we can easily see the descending price channel that has been pushing ETH lower in September. The coin reached resistance at around $4,000 at the start of the month and immediately rolled over from there as it started to fall.
Initially, ETH found support at $3,200, but this was eventually broken last week as ETH plummeted beneath $3,200 and continued lower until support was established at around $2,760.
Since meeting the support at $2,760, ETH has established a range over the past week between $2,760 and resistance at $3,200. It must go on to break this current range to dictate the next direction for the market.
A break beneath the lower boundary of the range might cause ETH to spiral lower into the August lows at around $2,400. On the other side, ETH would need to clear $3,200 to start the recovery process.
Ethereum price short term prediction: Neutral
ETH is considered to be neutral right now. The coin would need to break back above $3,400 to start to turn bullish again. On the other side, a drop beneath the support at $2,600 is likely to turn ETH bearish in the short term.
If the sellers push lower, the first support lies at $2,910 (.5 Fib Retracement). This is followed by support at $2,800, $2,760 (100-day MA), $2,680 (downside 1.618 Fib Extension), and $2,630 (200-day MA).
Where is the resistance toward the upside?
On the other side, the first resistance is expected at $3,000. This is followed by resistance at the upper angle of the price channel, $3,200 (bearish .382 Fib Retracement), $3,300 (50-day MA), $3,340 (bearish .618 Fib Retracement), and $3,500.
Above $3,500, additional resistance lies at $3,540 (bearish .618 Fib Retracement), $3,600, $3,782 (bearish .786 Fib Retracement), and $4,000.
ETH/BTC price analysis
What has been going on?
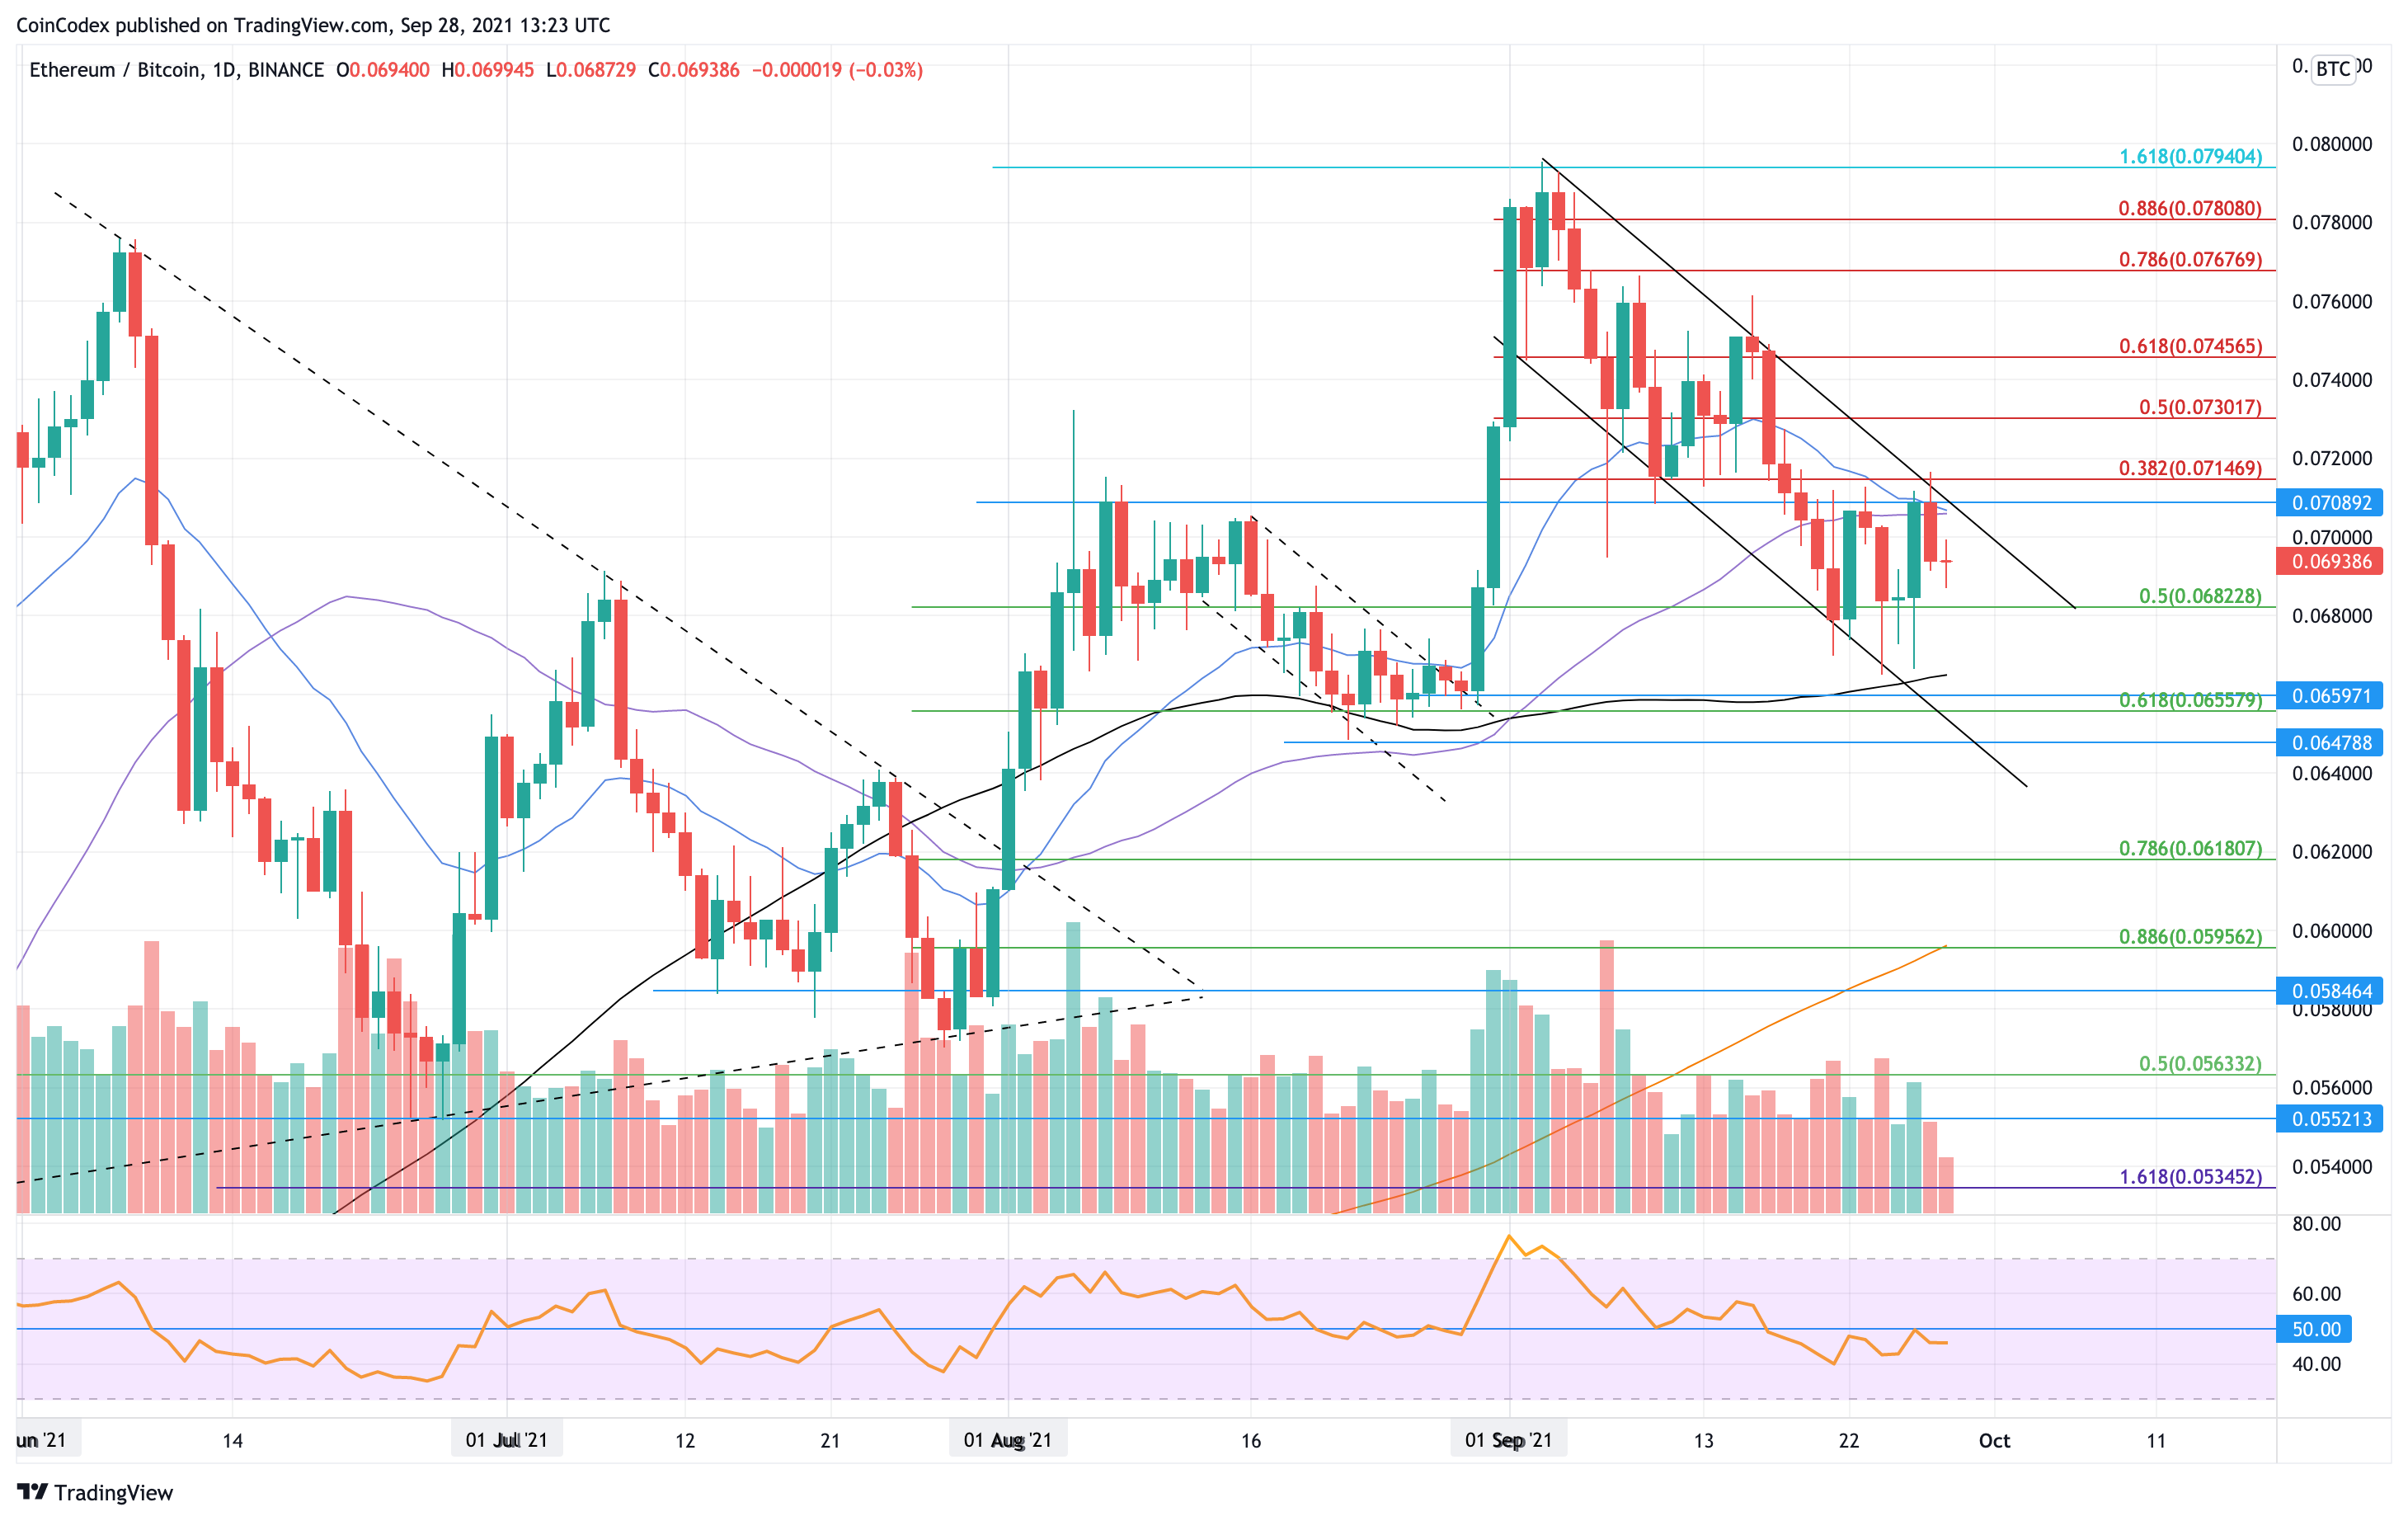
ETH is also trading inside a descending price channel against BTC as it heads lower from a high of ₿0.079 in September. Recently, the market managed to establish strong support at around ₿0.068, which is provided by a .5 Fib Retracement level.
It rebounded from the support at ₿0.068 last week and started to push higher but is struggling to overcome resistance at around ₿0.071.
ETH would need to break resistance at ₿0.071 to also climb above the upper angle of the descending price channel and end the short-term downward pressure.
Ethereum price short-term prediction: Neutral
ETH is neutral beneath the 50-day MA level at around ₿0.071. The coin would need to break ₿0.071 and pass resistance at ₿0.073 to start to be considered as bullish again. On the other side, a drop beneath the support at ₿0.066 (100-day MA) might be enough to turn ETH bearish in the short term.
If the sellers push lower, the first level of support lies at ₿0.068 (.5 Fib Retracement). This is followed by ₿0.066 (100-day MA), ₿0.0659, and ₿0.0655 (.618 Fib Retracement).
Additional support is then located at ₿0.0647, ₿0.064, ₿0.0618 (.786 Fib Retracement), and ₿0.06 (200-day MA).
Where is the resistance toward the upside?
On the other side, the first resistance lies at ₿0.07. This is followed by resistance at ₿0.071 (50-day MA), ₿0.0715 (bearish .382 FIb Retracement), and ₿0.072.
Additional resistance lies at ₿0.073 (bearish .5 Fib Retracement), ₿0.074, ₿0.0745 (bearish .618 Fib Retracement), and ₿0.076.
Keep up to date with the latest ETH price predictions here.