Ethereum’s resilience has been one of the significant talking points during the recent market crash as opposed to Bitcoin, ETH’s price has not created a new lower low. However, more downside could be expected if the price fails to break a key resistance level.
Technical Analysis
Technical Analysis By: Edris
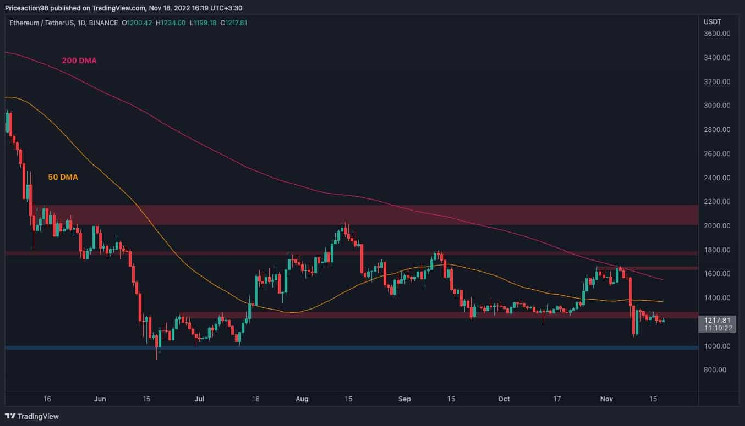
The Daily Chart:
On the daily chart, the cryptocurrency has been retesting the $1300 resistance level over the past few days after dropping below it earlier during the FTX-related crash. These efforts, however, have led to no positive result as the level is still holding strong and pushing the price lower.
In case of a significant bearish rejection, a continuation toward the $1000 support level would be expected. This would be the bulls’ last resort to stop ETH from plunging lower and making a new lower low. On the other hand, if the market finally breaks above the $1300 level, the 50-day and 200-day moving averages, located around the $1400 and $1550 marks, respectively, would be next in line as significant dynamic resistance levels.
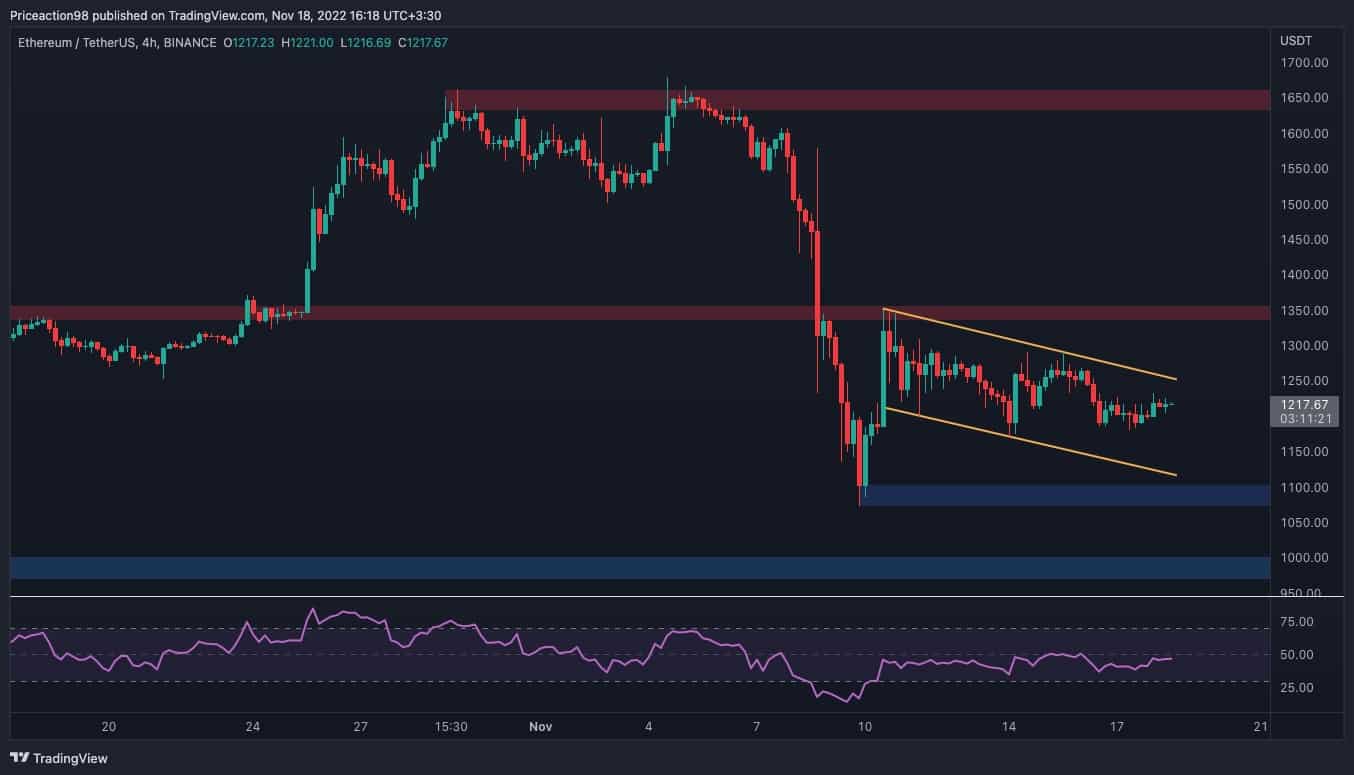
The 4-Hour Chart:
Looking at the 4-hour timeframe, it becomes clearer that the price ranges between $1100 and $1350 levels. Furthermore, a large bullish flag is seemingly forming on this timeframe which, if broken to the upside, could indicate a rally towards the $1350 level and likely beyond in the short term.
However, considering the current bearish market environment, the failure of the flag and drop toward the $1100 level could not be ruled out. The RSI indicator is also demonstrating a momentum equilibrium as it is oscillating around the 50% mark and does not provide any useful hint on the short-term direction of the price in this timeframe.