Ethereum’s price has been oscillating in a very compressed range between $1200 and $1400, showing minimum momentum to initiate a move to either side. However, the cryptocurrency is approaching significant dynamic levels, and the market is potentially close to showing its hand.
Technical Analysis
By: Edris
The Daily Chart
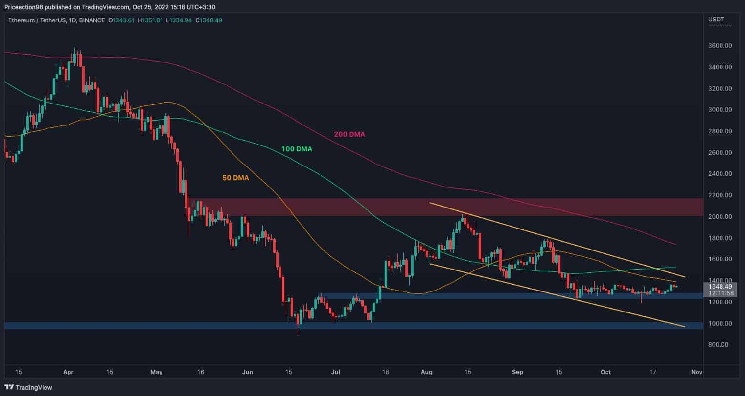
On the daily chart, the price has been forming a large descending channel over the past few months, which has yet to be broken to either side.
These channels could be considered large bullish flags, and a breakout to the upside could begin a new bullish phase. As a result, the price could rally toward the $2000 resistance area.
The 50-day moving average, currently located around $1400, could be the first obstacle that the price should break above in order for a bullish move to be anticipated.
On the other hand, the $1200 support area has been tested many times recently and could be broken to the downside as it is surely weakened. In this case, the $1000 level and the lower boundary of the channel are significant support levels to keep an eye on.
The 4-Hour Chart
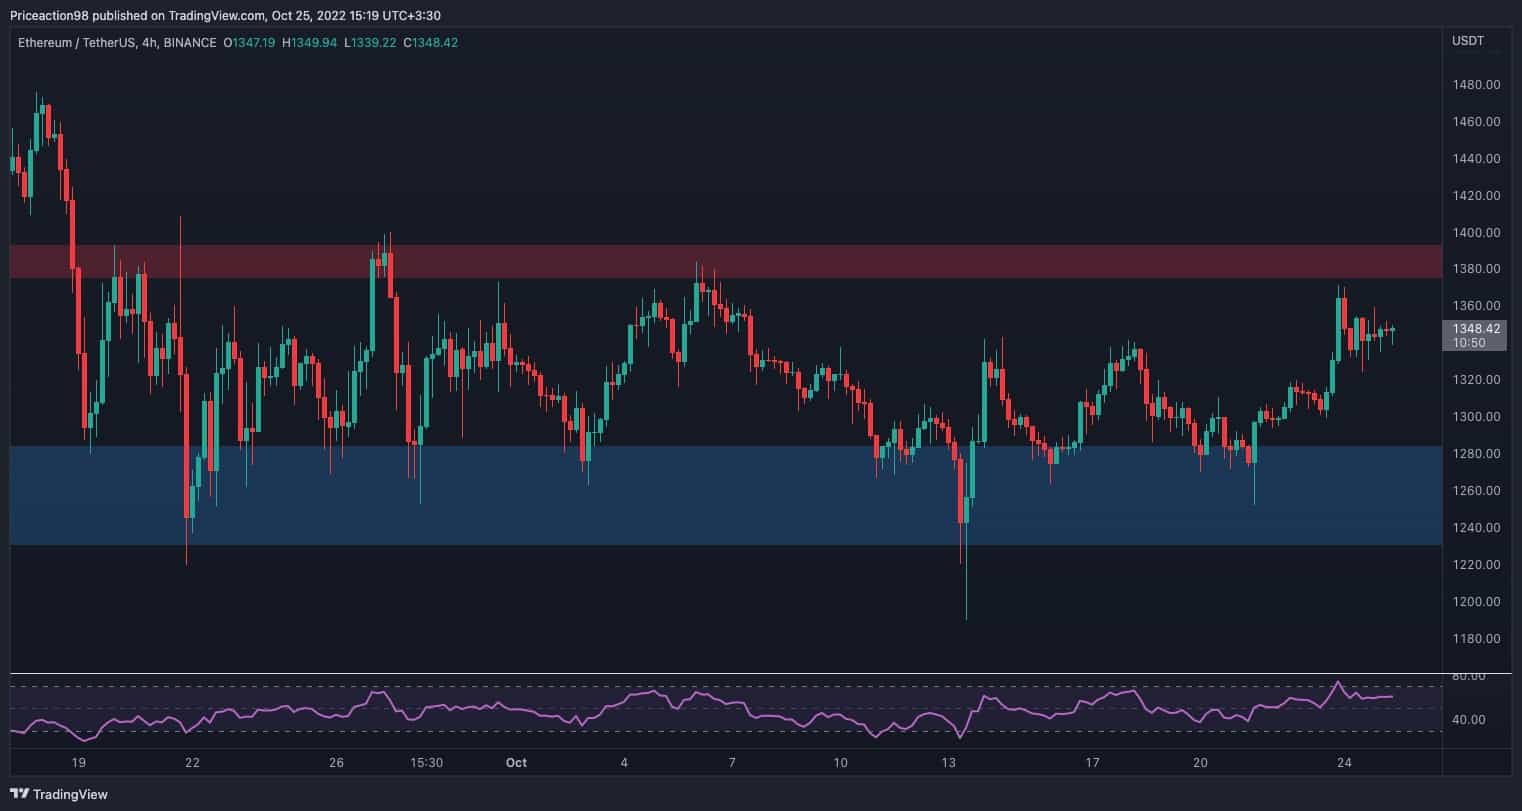
In the 4-hour timeframe, the choppy oscillations in the tight horizontal range between the $1200 and $1400 levels are much clearer. Both levels have been tested on multiple occasions while offering no significant clues on which level could be broken first.
Currently, the price is rising towards the $1400 resistance level, and in case of a breakout, the $1600 and $2000 levels could be the potential targets. However, the RSI indicator should be monitored closely in the next few days, as it has already demonstrated an overbought signal recently and could also form a bearish divergence. If so, another fake breakout and rejection from the mentioned resistance level would be the more probable outcome.
Sentiment Analysis
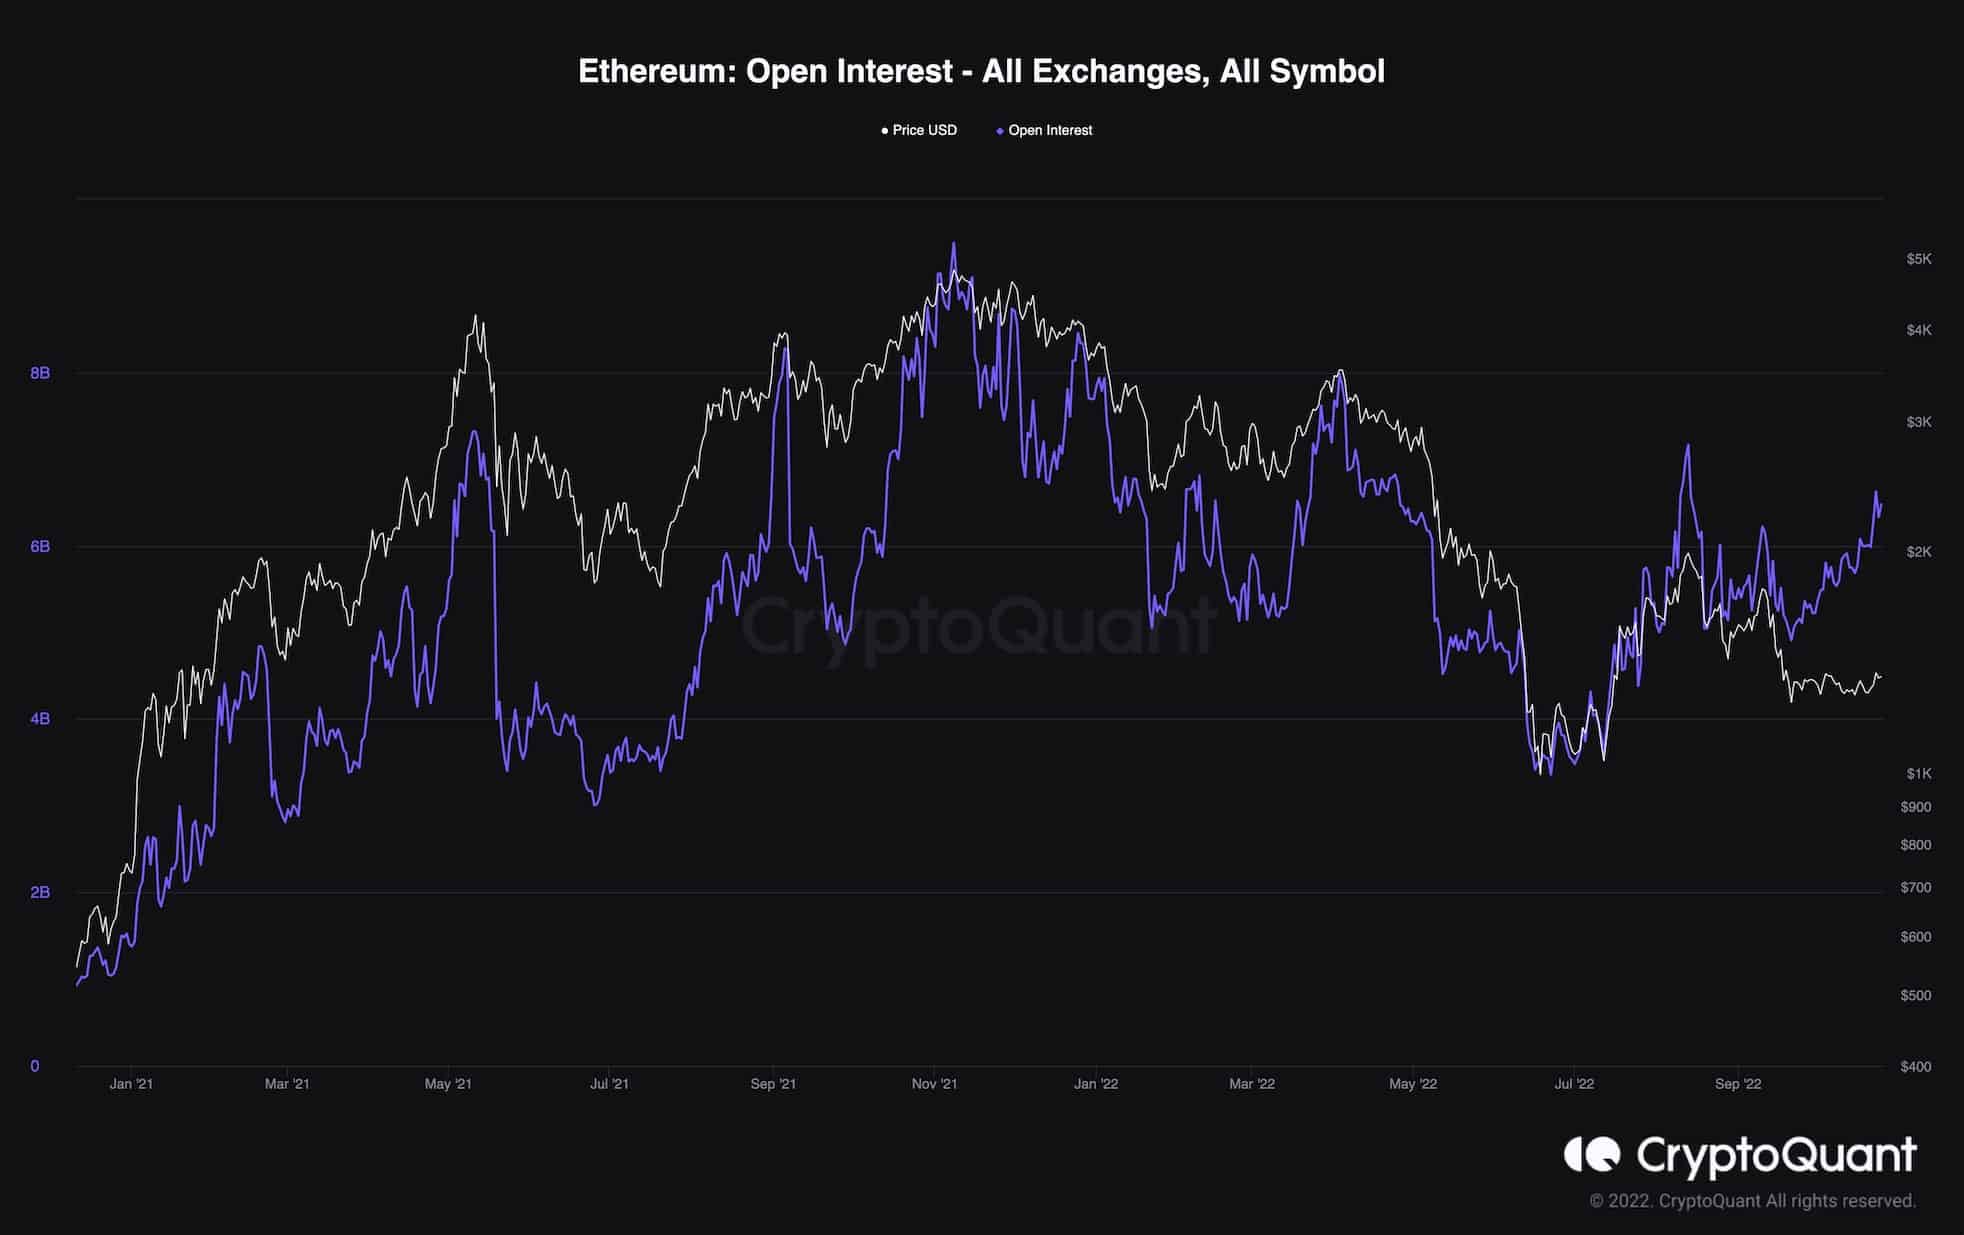
ETH Open Interest
While ETH’s price is barely showing any significant momentum towards either side, the futures market’s Open Interest is on the rise.
The Open Interest metric is one of the most useful tools for evaluating the futures market sentiment. Higher Open Interests indicate higher quantities of open futures contracts regardless of their direction.
So, an increase in this metric means that many traders have been opening futures positions in recent weeks. These positions could be used for hedging against a price decline or simply gaining profits. Either way, liquidation of these leveraged positions could lead to massive bullish or bearish moves, which could reshape the short-term future of the market. Considering the recent choppy price action, the market may be experiencing the calm before the storm.