ETH/USD – Ether Returns To 20-day MA Support
Key Support Levels: $3000, $2960, $2890.
Key Resistance Levels: $3170, $3360, $3540.
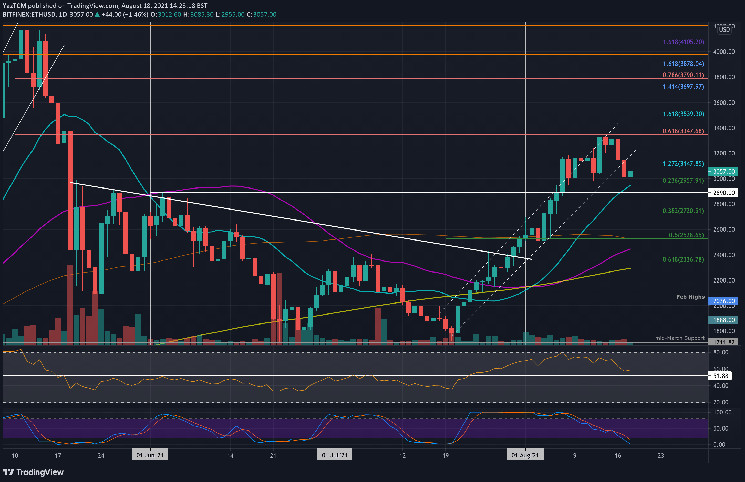
After surging by almost 94% over the past three weeks, Ethereum has finally seen a meaningful retracement. The coin is now down by a total of around 8% since hitting $3350 at the start of the week.
The cryptocurrency met resistance at $3350 (bearish .618 Fib) over the weekend and failed to establish momentum above that. There were signs of bearish divergence, which caused ETH to roll over and hit the 20-day MA today. A .236 Fib further bolstered the support at the 20-day MA, and it allowed ETH to bounce back above $3000 to the current $3050 level.
ETH-USD Short Term Price Prediction
Looking ahead, the first resistance now lies around $3170. This is followed by $3350 (bearish .618 Fib), $3540 (1.618 Fib Extension), and $3790 (bearish .786 Fib).
On the other side, the first support lies at $3000. This is followed by $2960 (.236 Fib & 20-day MA), $2890 (June highs), and $2720 (.382 Fib).
As mentioned, the RSI showed bearish divergence and has pulled back from overbought conditions. It still remains above the midline, indicating that the bulls are still in control of the market momentum.
ETH/BTC – ETH Breaks Beneath Short-Term Symmetrical Triangle
Key Support Levels: 0.067 BTC, 0.066 BTC, 0.0651 BTC.
Key Resistance Levels: 0.0691 BTC, 0.07 BTC, 0.072 BTC.
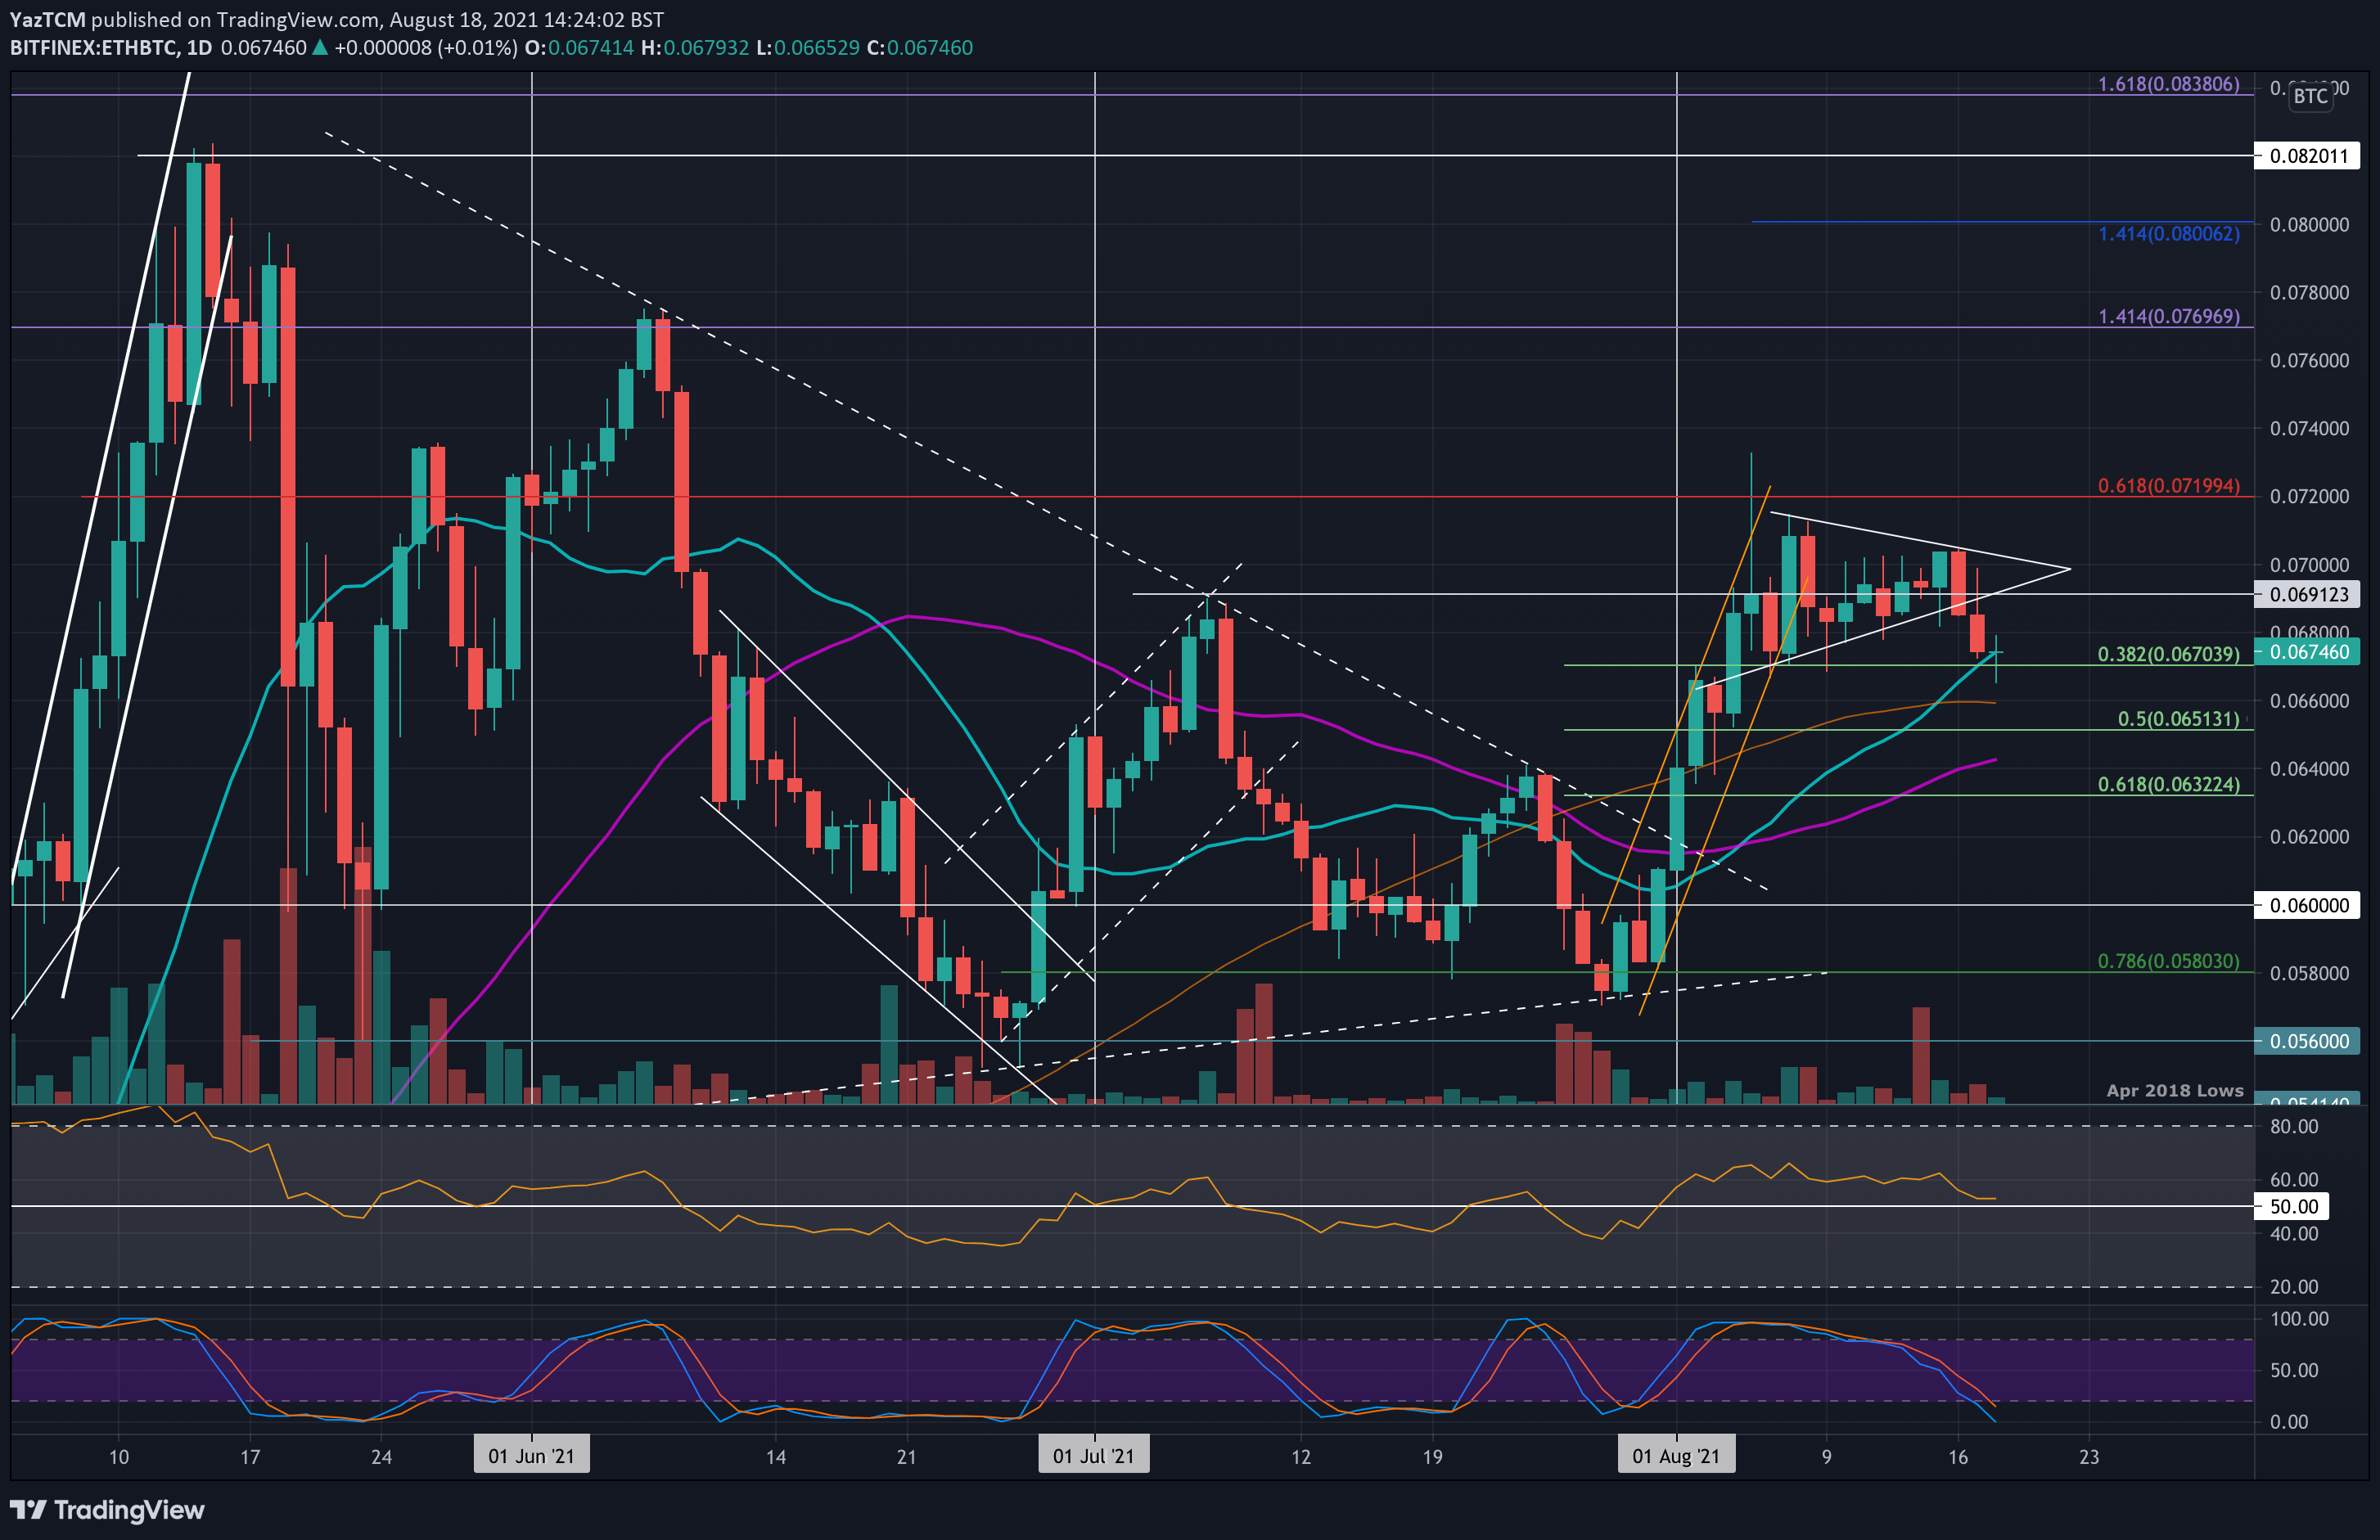
ETH had been trading inside a symmetrical triangle pattern since the first week of August. It eventually broke beneath the triangle yesterday as ETH dipped beneath 0.068 BTC. Today, ETH fell as low as 0.0665 BTC but is battling to remain above the 20-day MA at 0.0675 BTC.
Again, the retracement is quite healthy after ETH surged as much as 25% from the July lows to meet resistance around 0.071 BTC.
ETH-BTC Short Term Price Prediction
Moving forward, the first support toward the downside lies at 0.067 BTC (.382 Fib). This is followed by 0.066 BTC (100-day MA), 0.0651 BTC (.5 Fib), and 0.064 BTC (50-day MA).
On the other side, the first resistance lies at 0.0691 BTC (July highs). This is followed by 0.07 BTC, 0.072 BTC (beraish .618 Fib), and 0.074 BTC.
The RSI has returned to the midline, indicating indecision within the market. So long as the RSI does not dip beneath 50, the buyers could be able to force a recovery back above 0.07 BTC soon.