The weekend has started with a correction on the cryptocurrency market as most of the coins are in the green zone again.
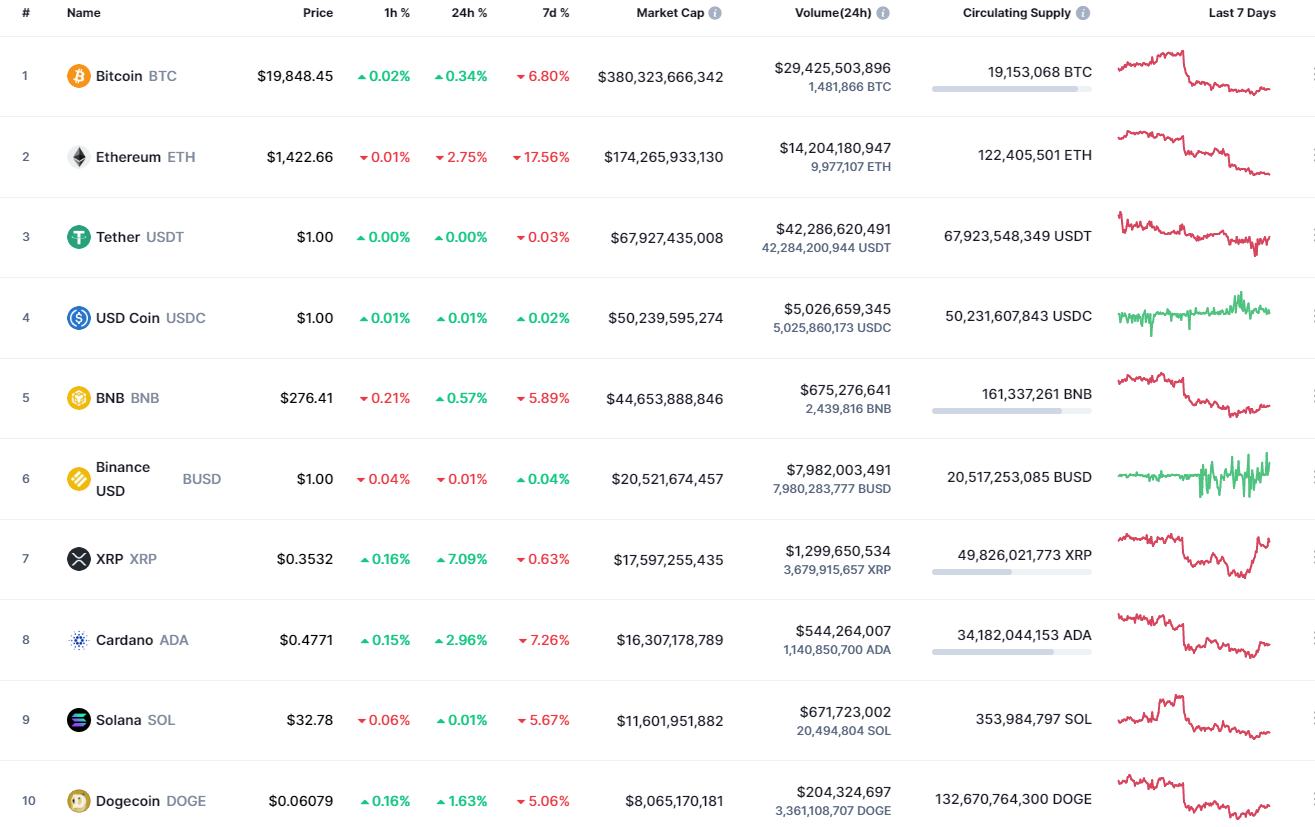
ETH/USD
Unlike other digital assets, Ethereum (ETH) keeps falling, going down by 2.75%.
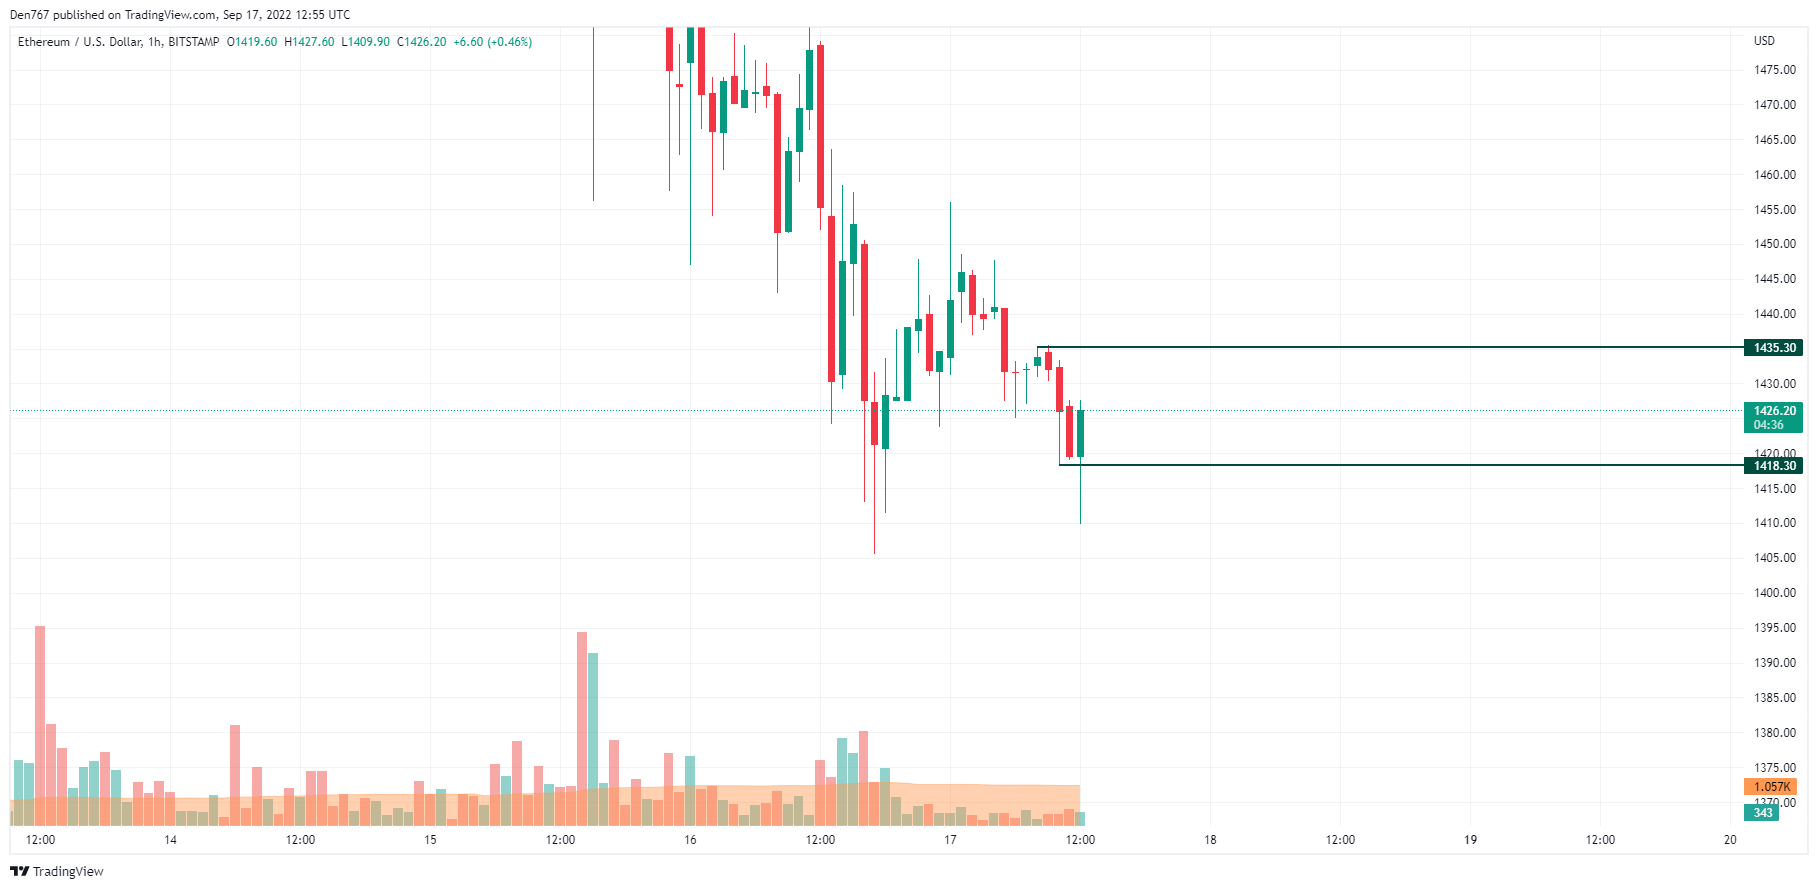
On the hourly time frame, Ethereum (ETH) has made a false breakout of the support level at $1,418 against the increased volume. If buyers can hold this zone, there is a chance to see a test of the resistance at $1,435 shortly.
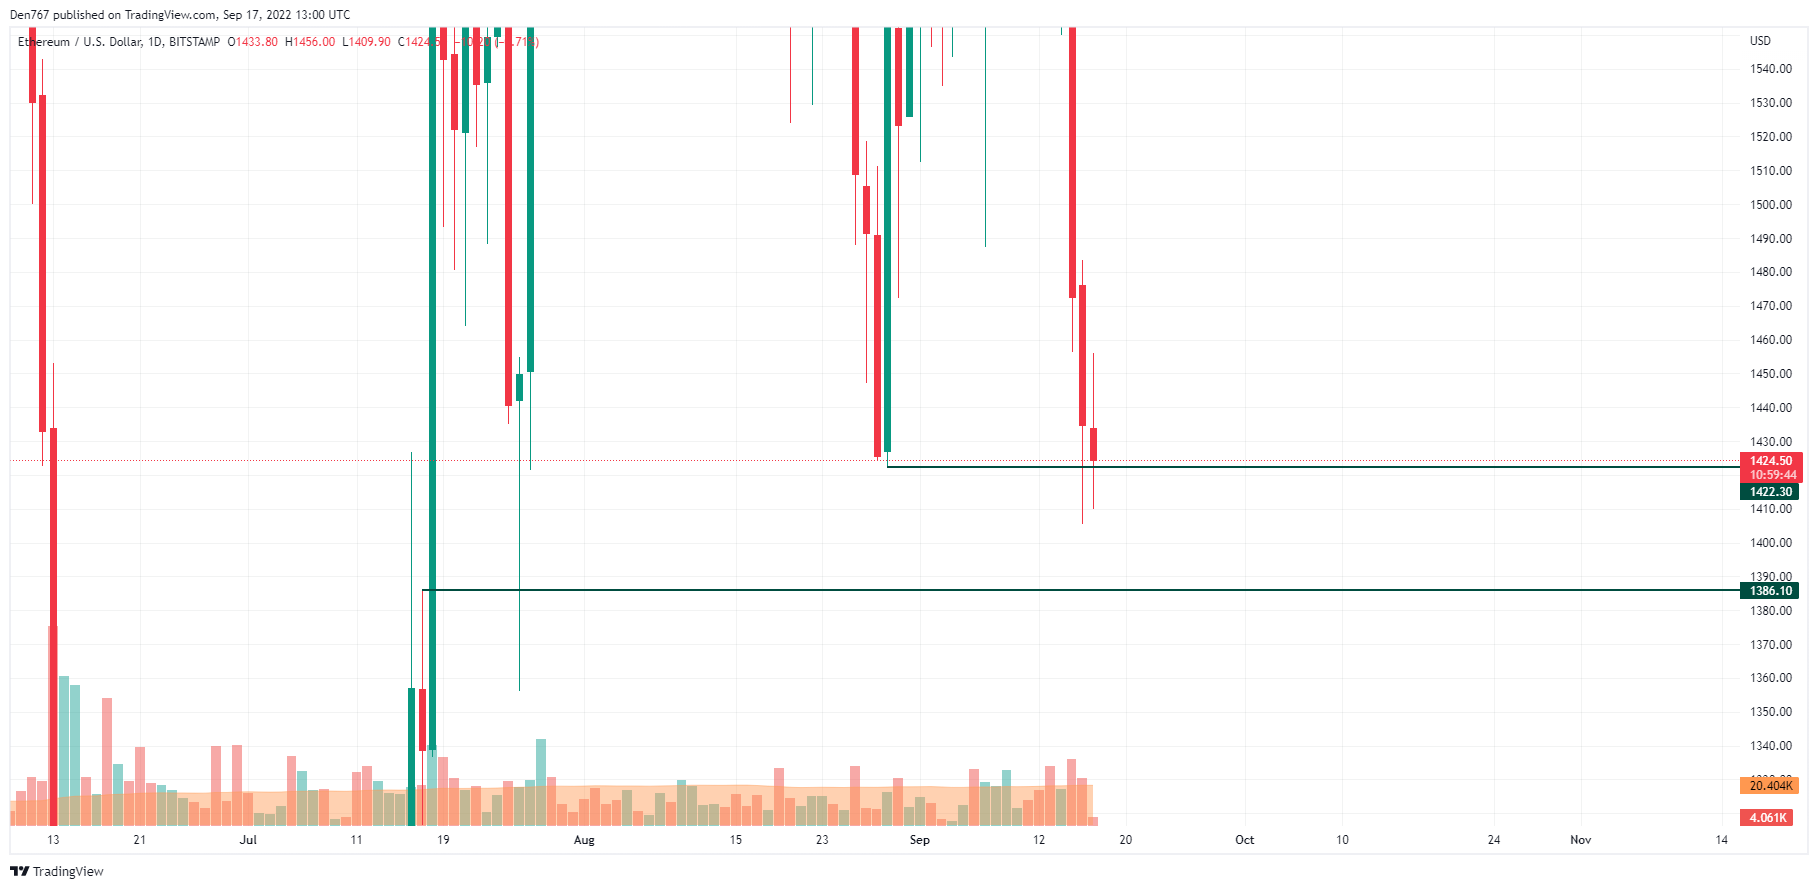
On the daily chart, Ethereum (ETH) is looking bearish as the price is very close to the support level at $1,422. If the candle closes below it, it might a reason for a sharp drop to the $1,400 area next week.
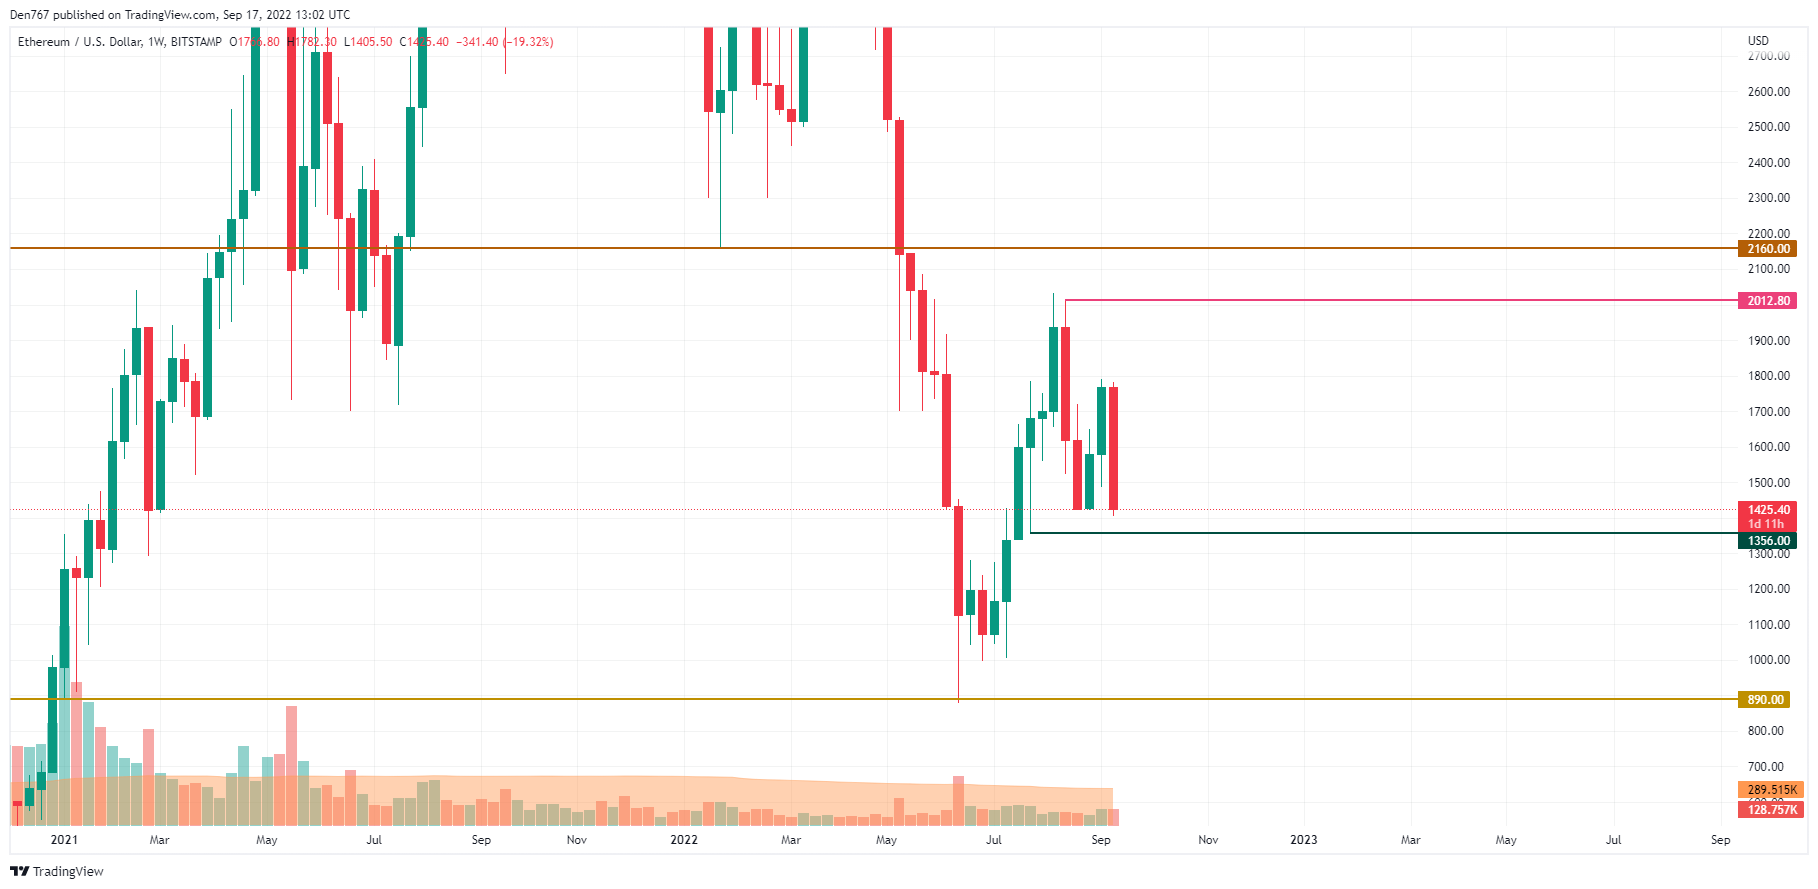
The situation is similar on the weekly chart as Ethereum (ETH) is likely to close below the psychological $1,500 mark. Respectively, the upcoming week might also be bearish for the main altcoin, so traders can expect to see a decline to the $1,356 mark.
Ethereum is trading at $1,426 at press time.