Ethereum [ETH], the second largest cryptocurrency by market cap, was indecisive about whether it wanted to ride with the bulls, or whether it wanted to go down the path of the beat market.
According to CoinMarketCap, Ethereum was trading at $137.28 with a market cap of $14.46 billion, at press time. The trading volume of the cryptocurrency was recorded to be $4.12 billion, while its price witnessed a fall of around 2% over the past seven days.
1-hour
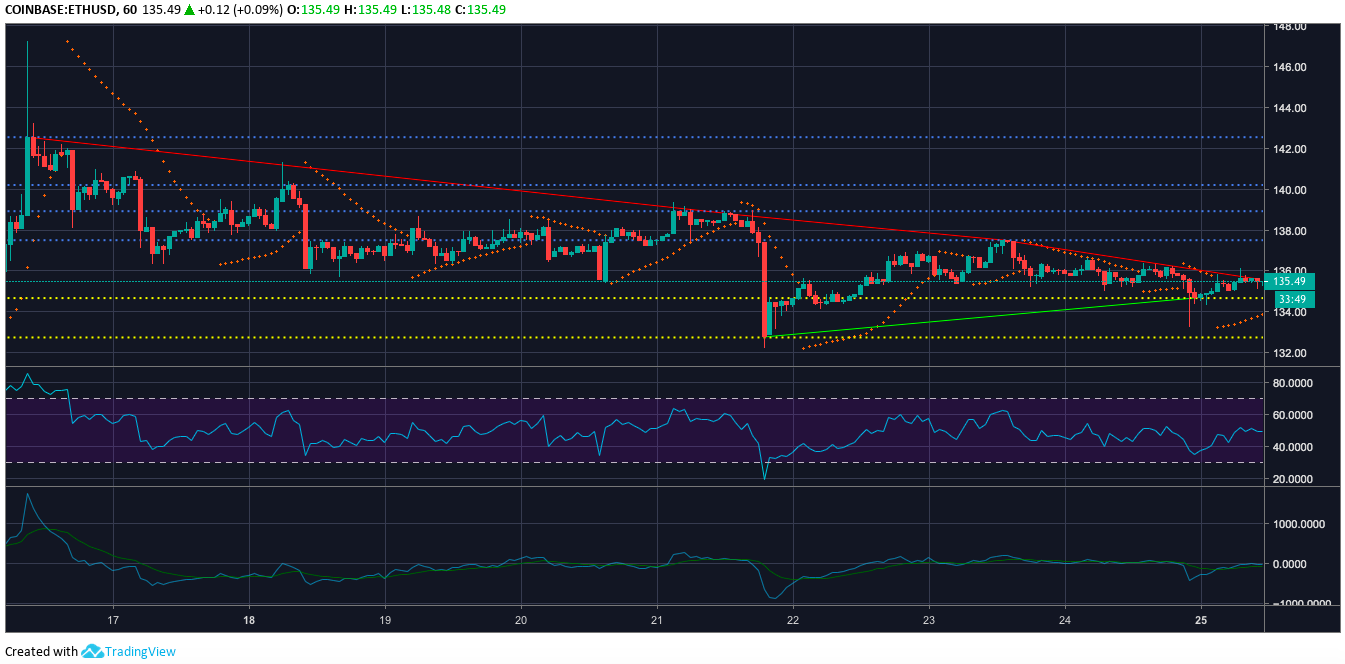
Ethereum one-hour price chart | Source: Trading View
The one-hour chart for the cryptocurrency recorded three significant downtrends, from $142.52 to $138.83, from $138.76 to $137.49, and from $137.43 to $135.61. The uptrend for the coin was drawn from $132.77 to $134.68.
The immediate resistance for the cryptocurrency was at $137.51 and the strong resistance was at $140.21. The coin’s immediate support was placed at $134.67 and strong support was at $132.75.
Parabolic SAR pictured a bull market for the coin as the dotted lines were perfectly aligned below the candlesticks.
Klinger Oscillator sided with the Parabolic SAR as the reading line moved above the signal line after a crossover.
RSI showed that the buying pressure for the cryptocurrency was the same as the selling pressure.
1-day
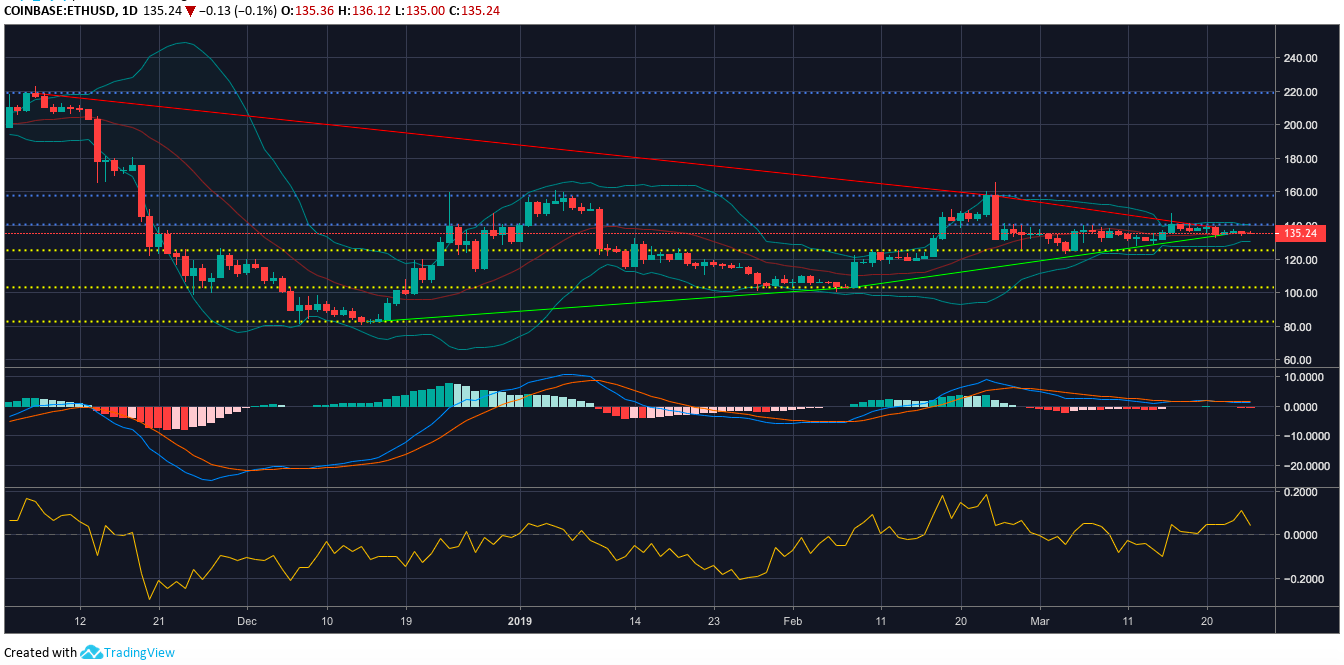
Ethereum one-day price chart | Source: Trading View
On the one-day chart, the coin had two prominent downtrends, from $218.66 to $157.55 and further from $157.55 to $138.72. The uptrends for the cryptocurrency were from $82.92 to $103.22 and from $103.22 to $134.47.
The immediate resistance for the cryptocurrency was at $140.53 and strong resistance was at $157.75. The immediate support for the coin was at $125.17, while strong support was found at $82.78.
MACD was seen drawing the coin towards the bear’s side as the moving average line shifted below the signal line after a crossover.
Chaikin Money Flow showed that money was flowing into the market, a bullish sign for the coin market.
Bollinger Bands forecast a non-volatile market as the bands were closing in on each other.
Conclusion
At press time, major indicators such as the CMF from the one-day chart and Parabolic SAR and Klinger Oscillator from the one-hour chart, projected a bull market for the coin.