Key highlights:
- Ethereum dropped by a sharp 7% today as it plummets into the $1,700 region
- The cryptocurrency remains inside a descending wedge but is testing the lower boundary
- Against Bitcoin itself, Ethereum is battling to remain above a rising trend line at ₿0.059 after falling beneath the 100-day MA last week
| Ethereum price | $1,760 |
|---|---|
| Key ETH resistance levels | $1,800, $,1900, $1,990, $2,000, $2,060 |
| Key ETH support levels | $1,715, $1,700, $1,650, $1,600, $1,577 |
*Price at the time of publication
Ethereum fell by a sharp 7% today, mainly because Bitcoin dropped beneath the $30,000 price level. Despite today’s price fall, ETH has been trading lower since the start of July after failing to break resistance at $2,365, provided by the 50-day MA. Since then, it has been trading inside a descending wedge formation, and today’s price fall has dropped into the lower boundary.
The 7% price drop today also caused ETH to fall beneath support at $1800 (.886 Fib) and, if today’s candle closes beneath there, it would be the lowest daily candle close since March.
The recent price plummet has many investors on edge ahead of the significant London network upgrade. ETH holders have been looking forward to the upgrade as it will introduce a highly anticipated EIP-1559 change that will introduce some deflationary pressure to the ETH supply.
Scheduled for August 4th, the EIP-1559 update will introduce a “burning” mechanism in which the base fee is burnt, and an optional tip is paid to the miners.
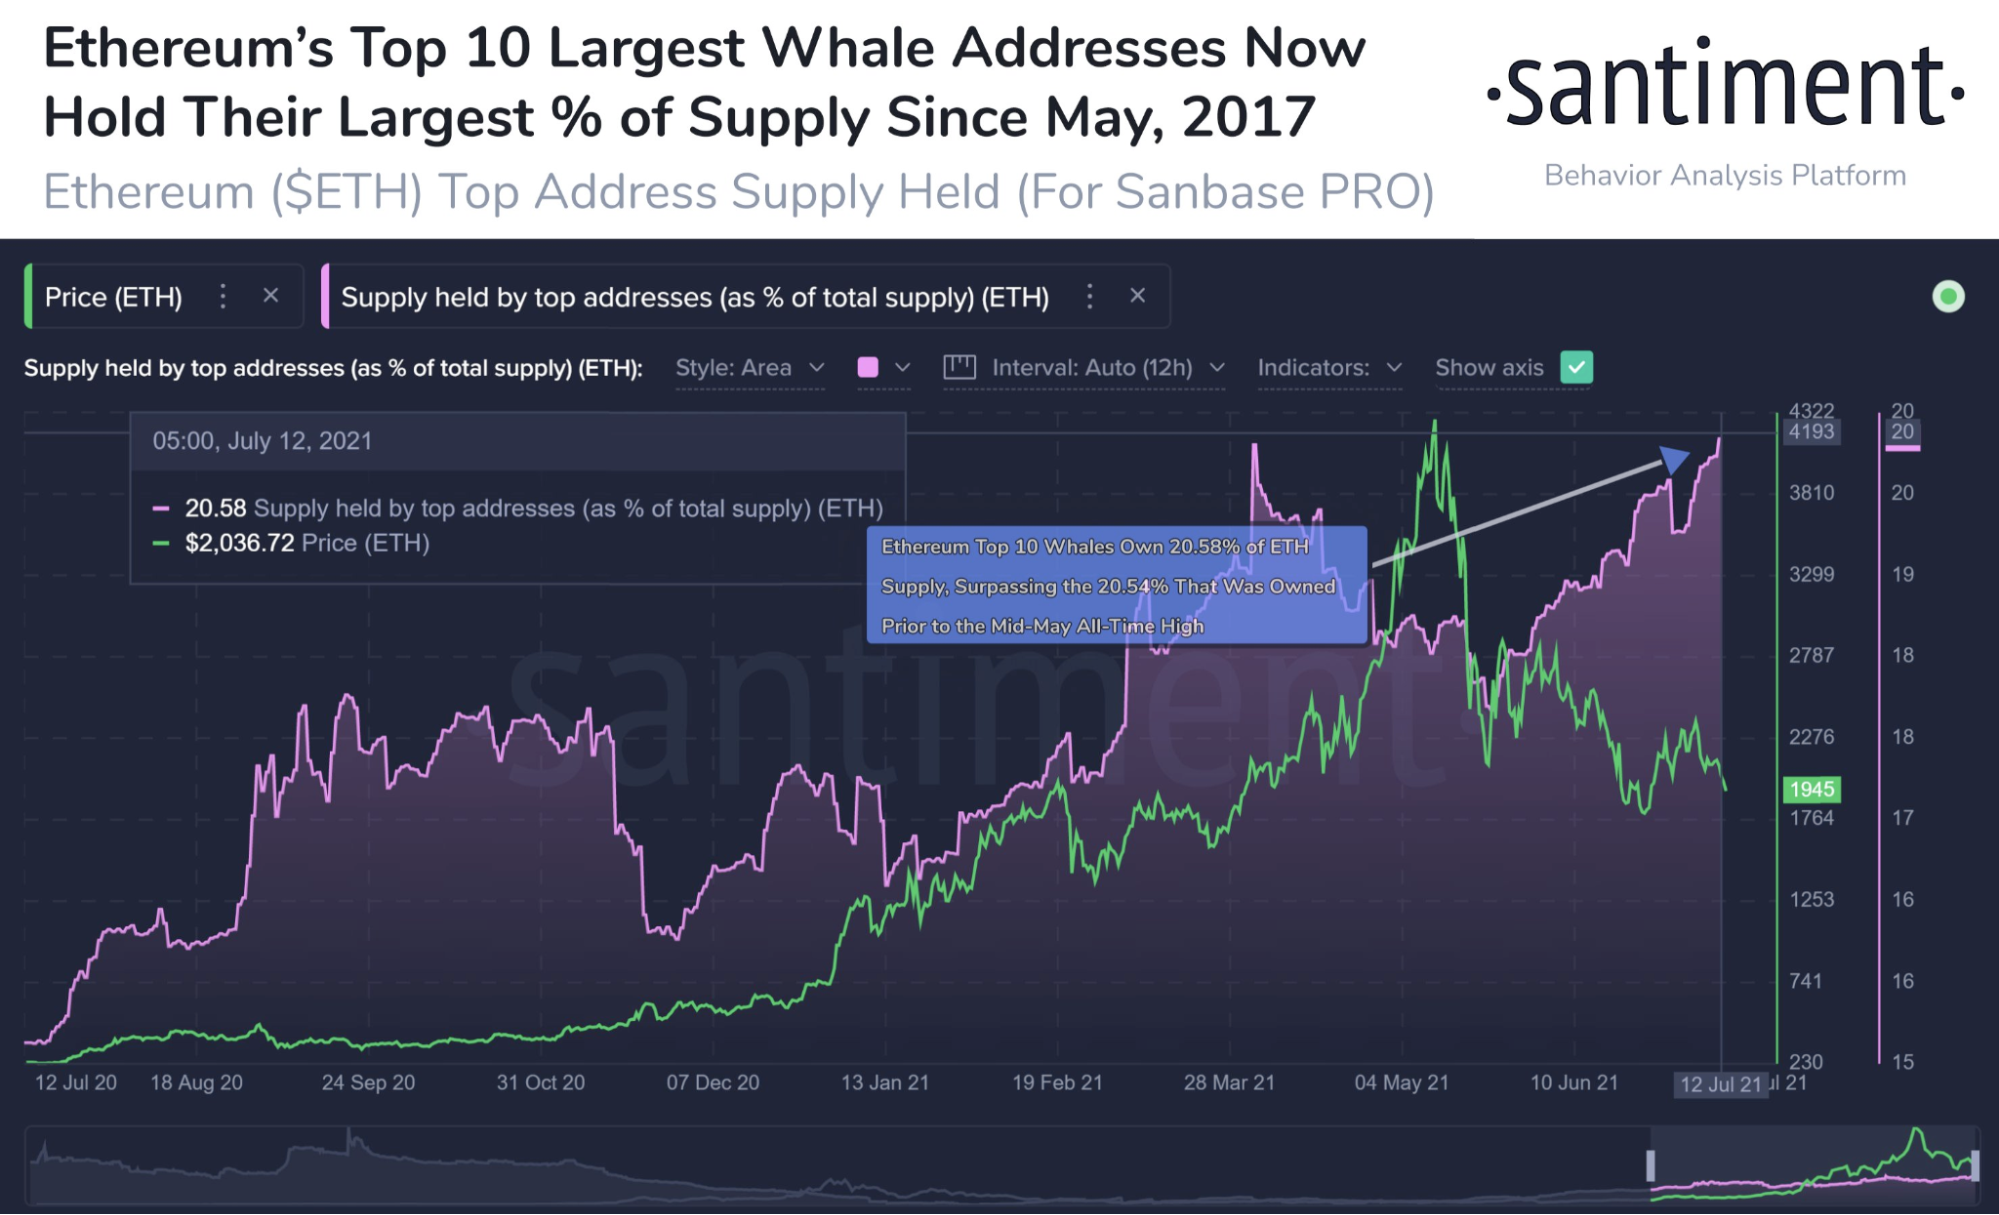
Regardless of the July price decline, it seems that whales are still buying up ETH at increasing rates. According to data from Santiment, the top 10 largest holders continue to increase their stake in the network as they collectively own around 20.58% of the overall supply:
In addition to this, the total ETH supply on exchanges has dropped to levels not seen since 2018:
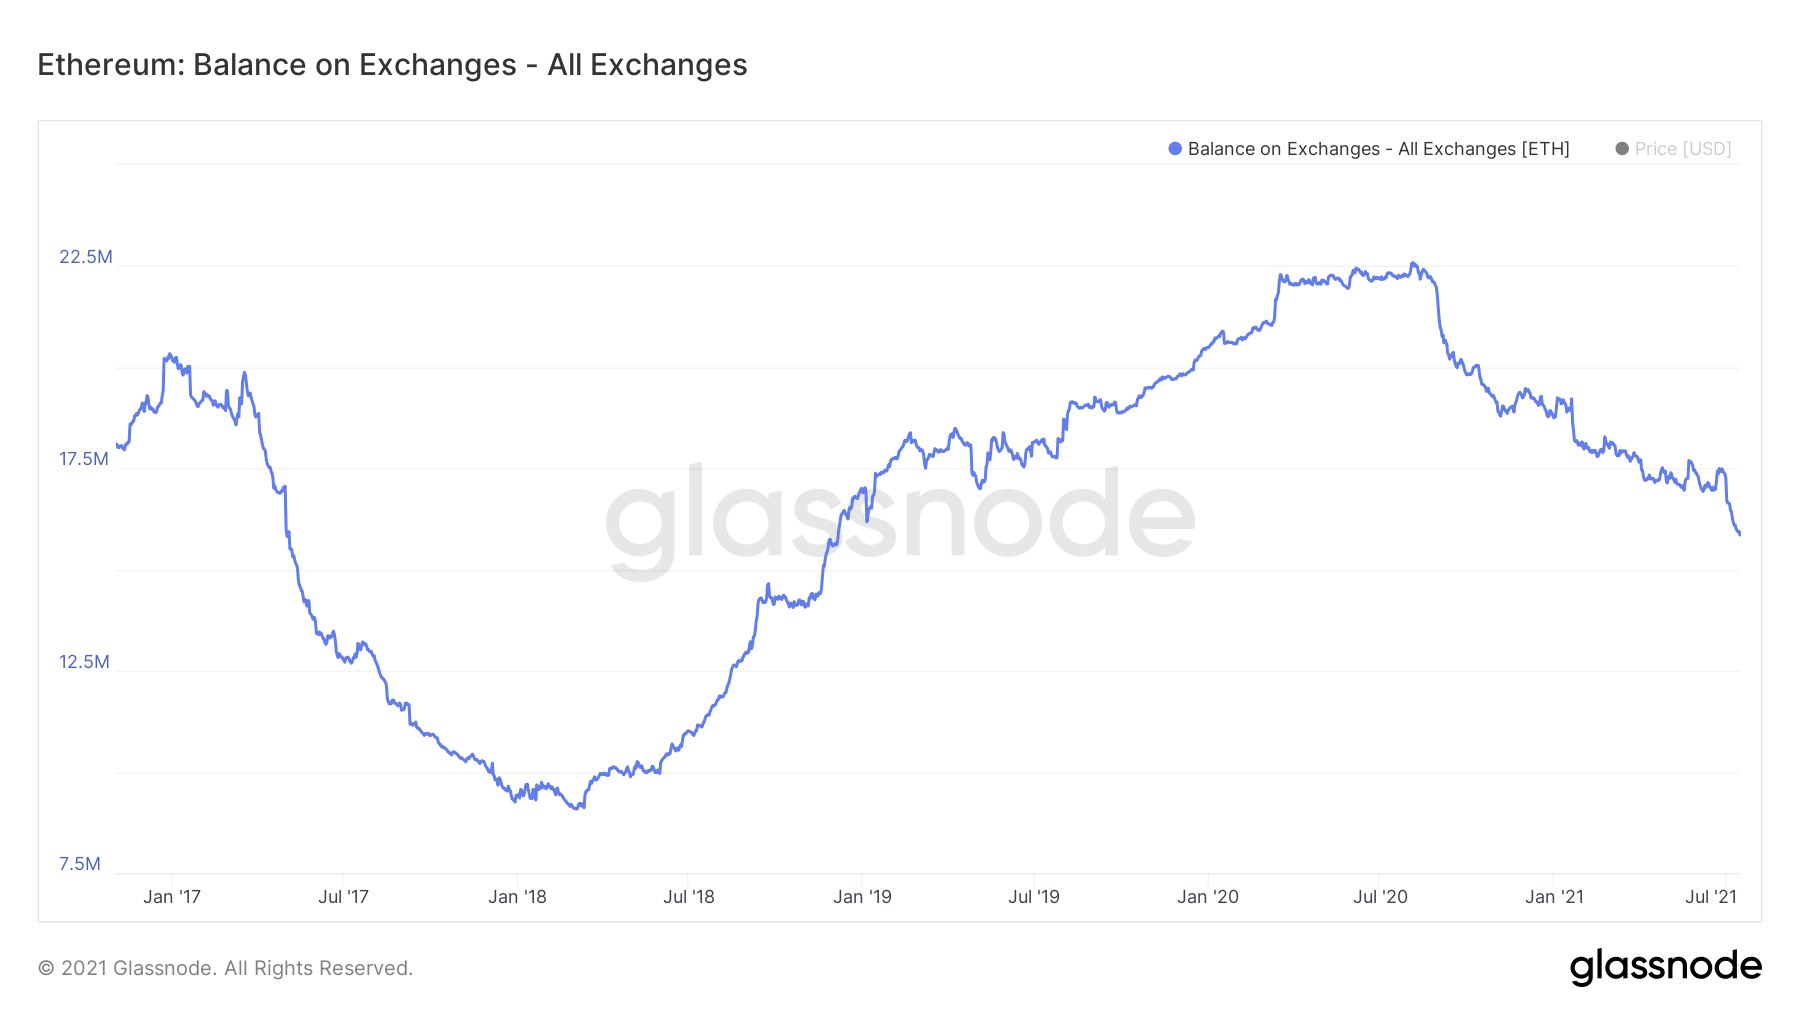
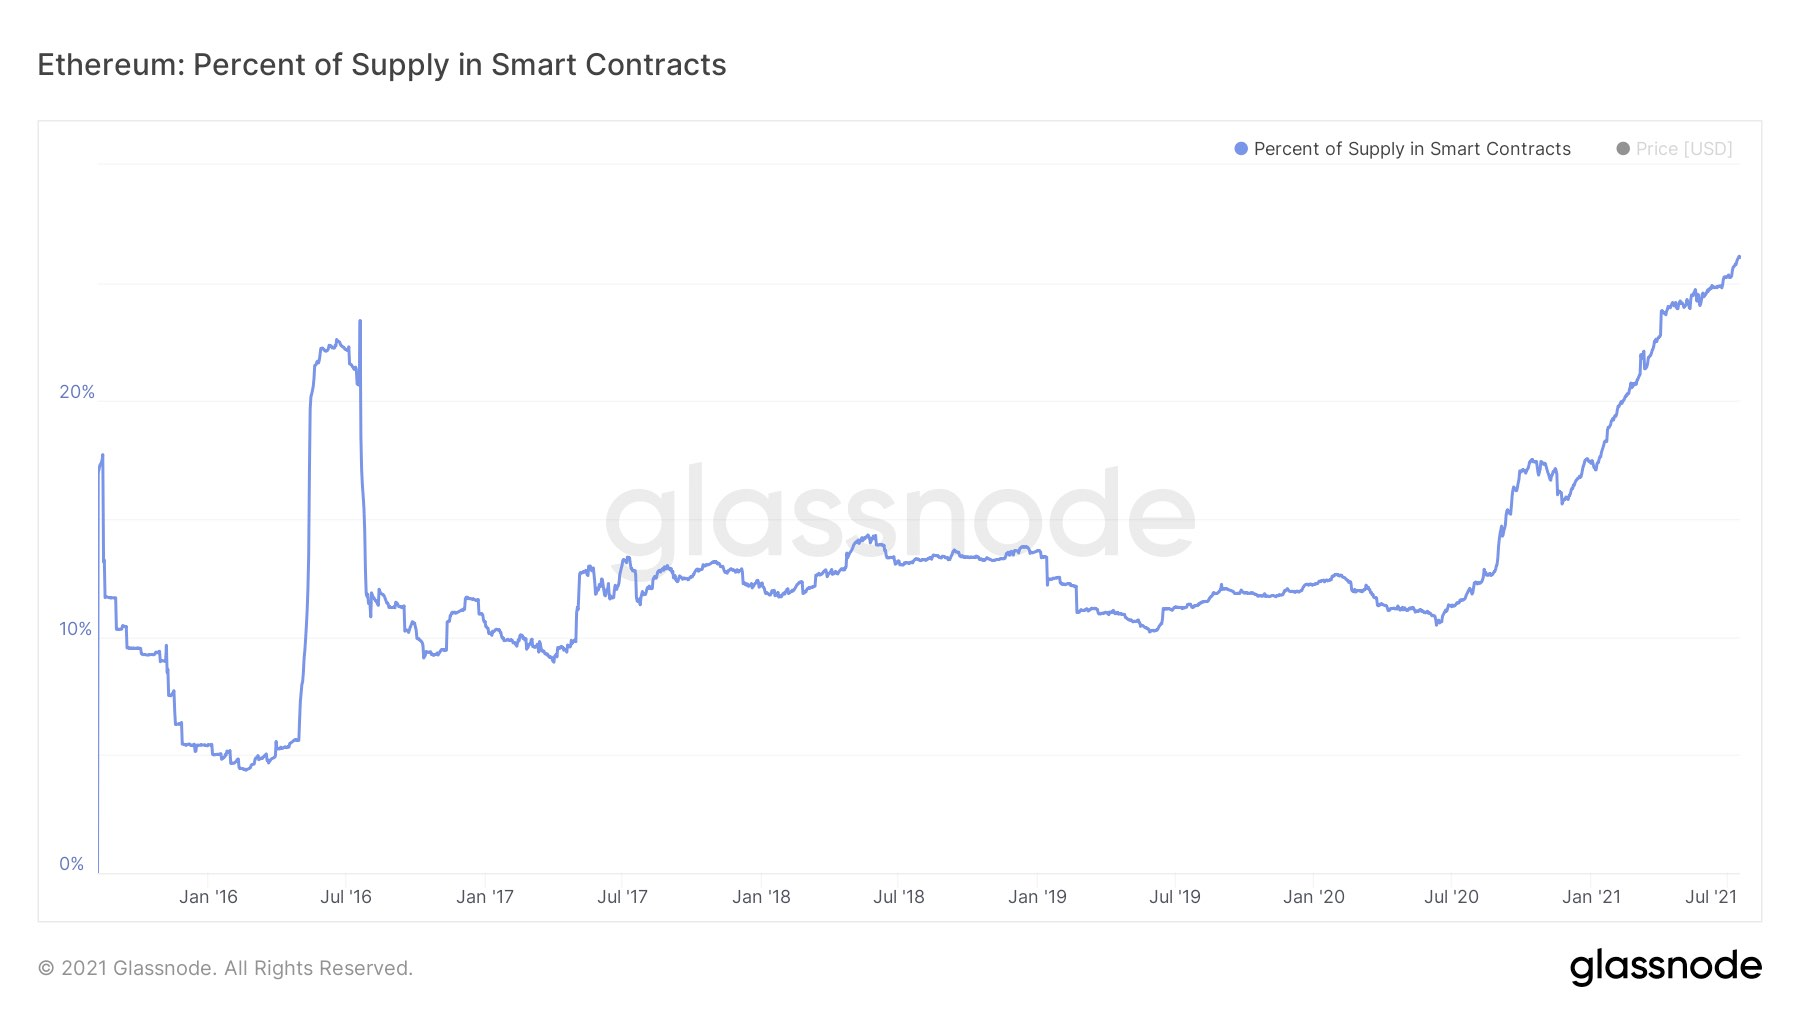
The drop in ETH on exchanges is likely due to the fact that hodlers are accumulating and removing the ETH into cold storage. However, it is also possibly due to the fact that hodlers might be sending their ETH to smart contracts, such as the ETH 2.0 staking contract. The total percent of ETH supply in Smart Contracts recently rocketed above the 26% level, creating a fresh new all-time high:
The market cap for Ethereum has now plummeted to the $204 billion level. Let us continue to take a look at the markets and see where they might be heading.
Ethereum price analysis
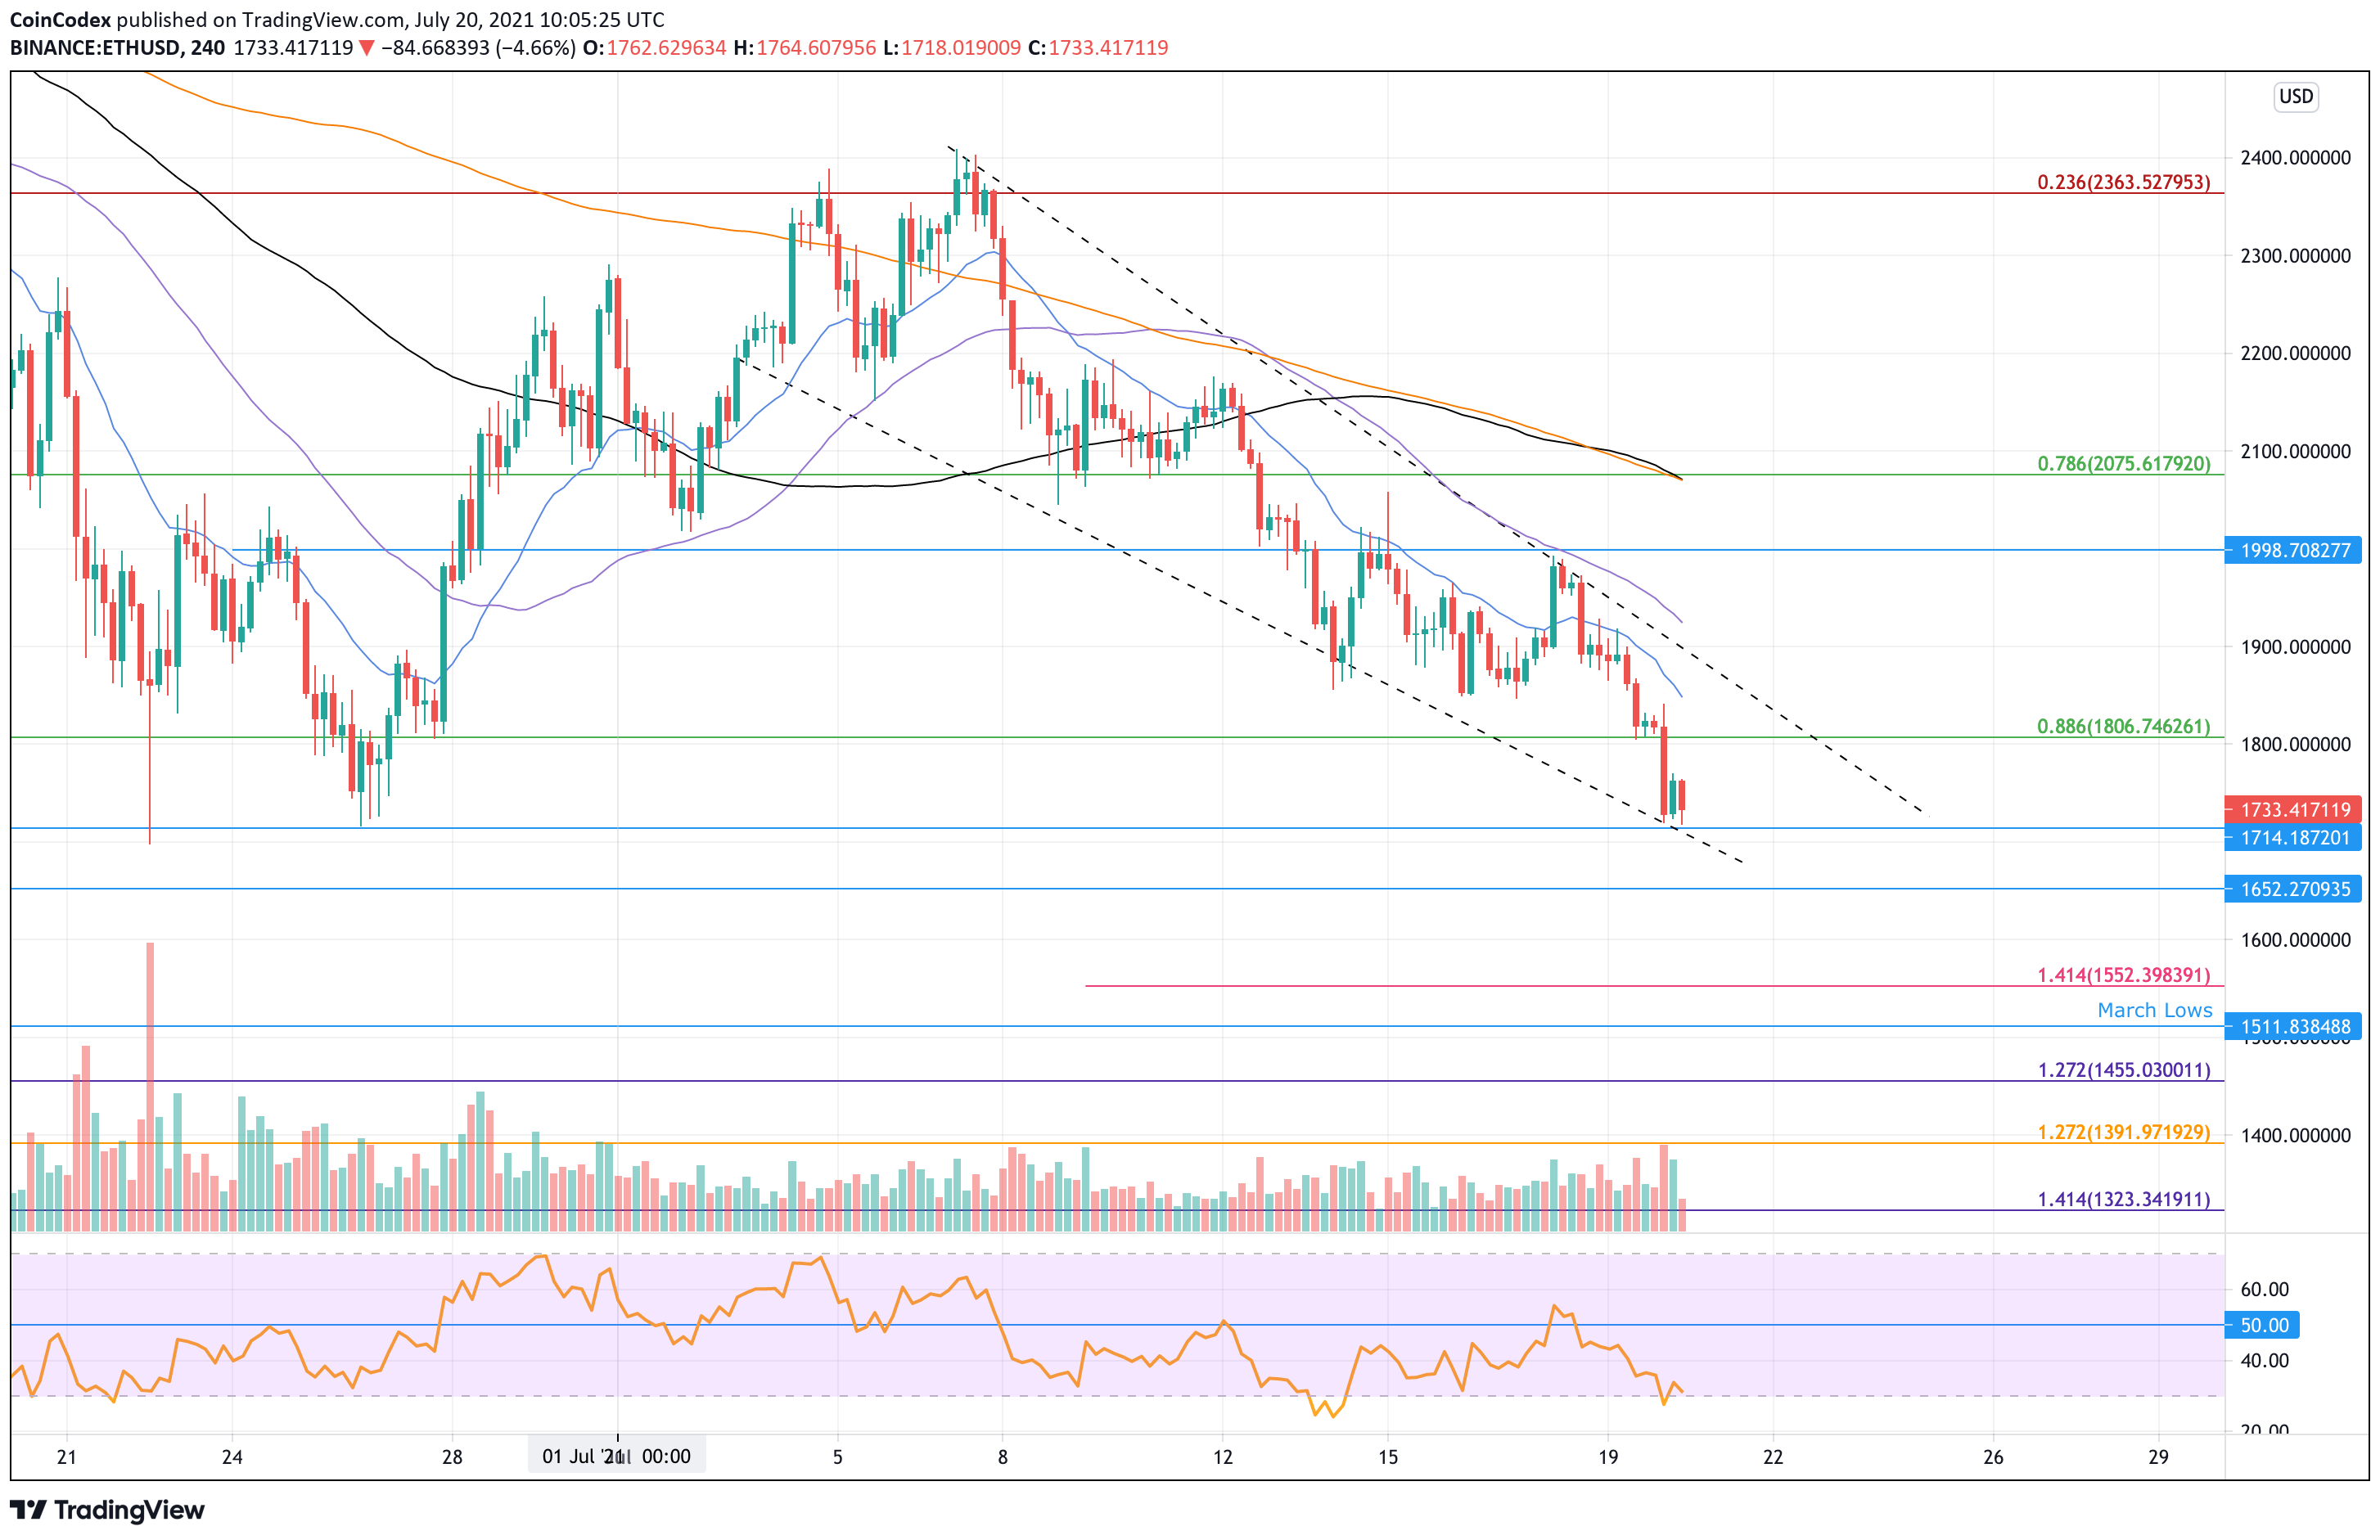
Daily chart:
4-hour chart:
What has been going on?
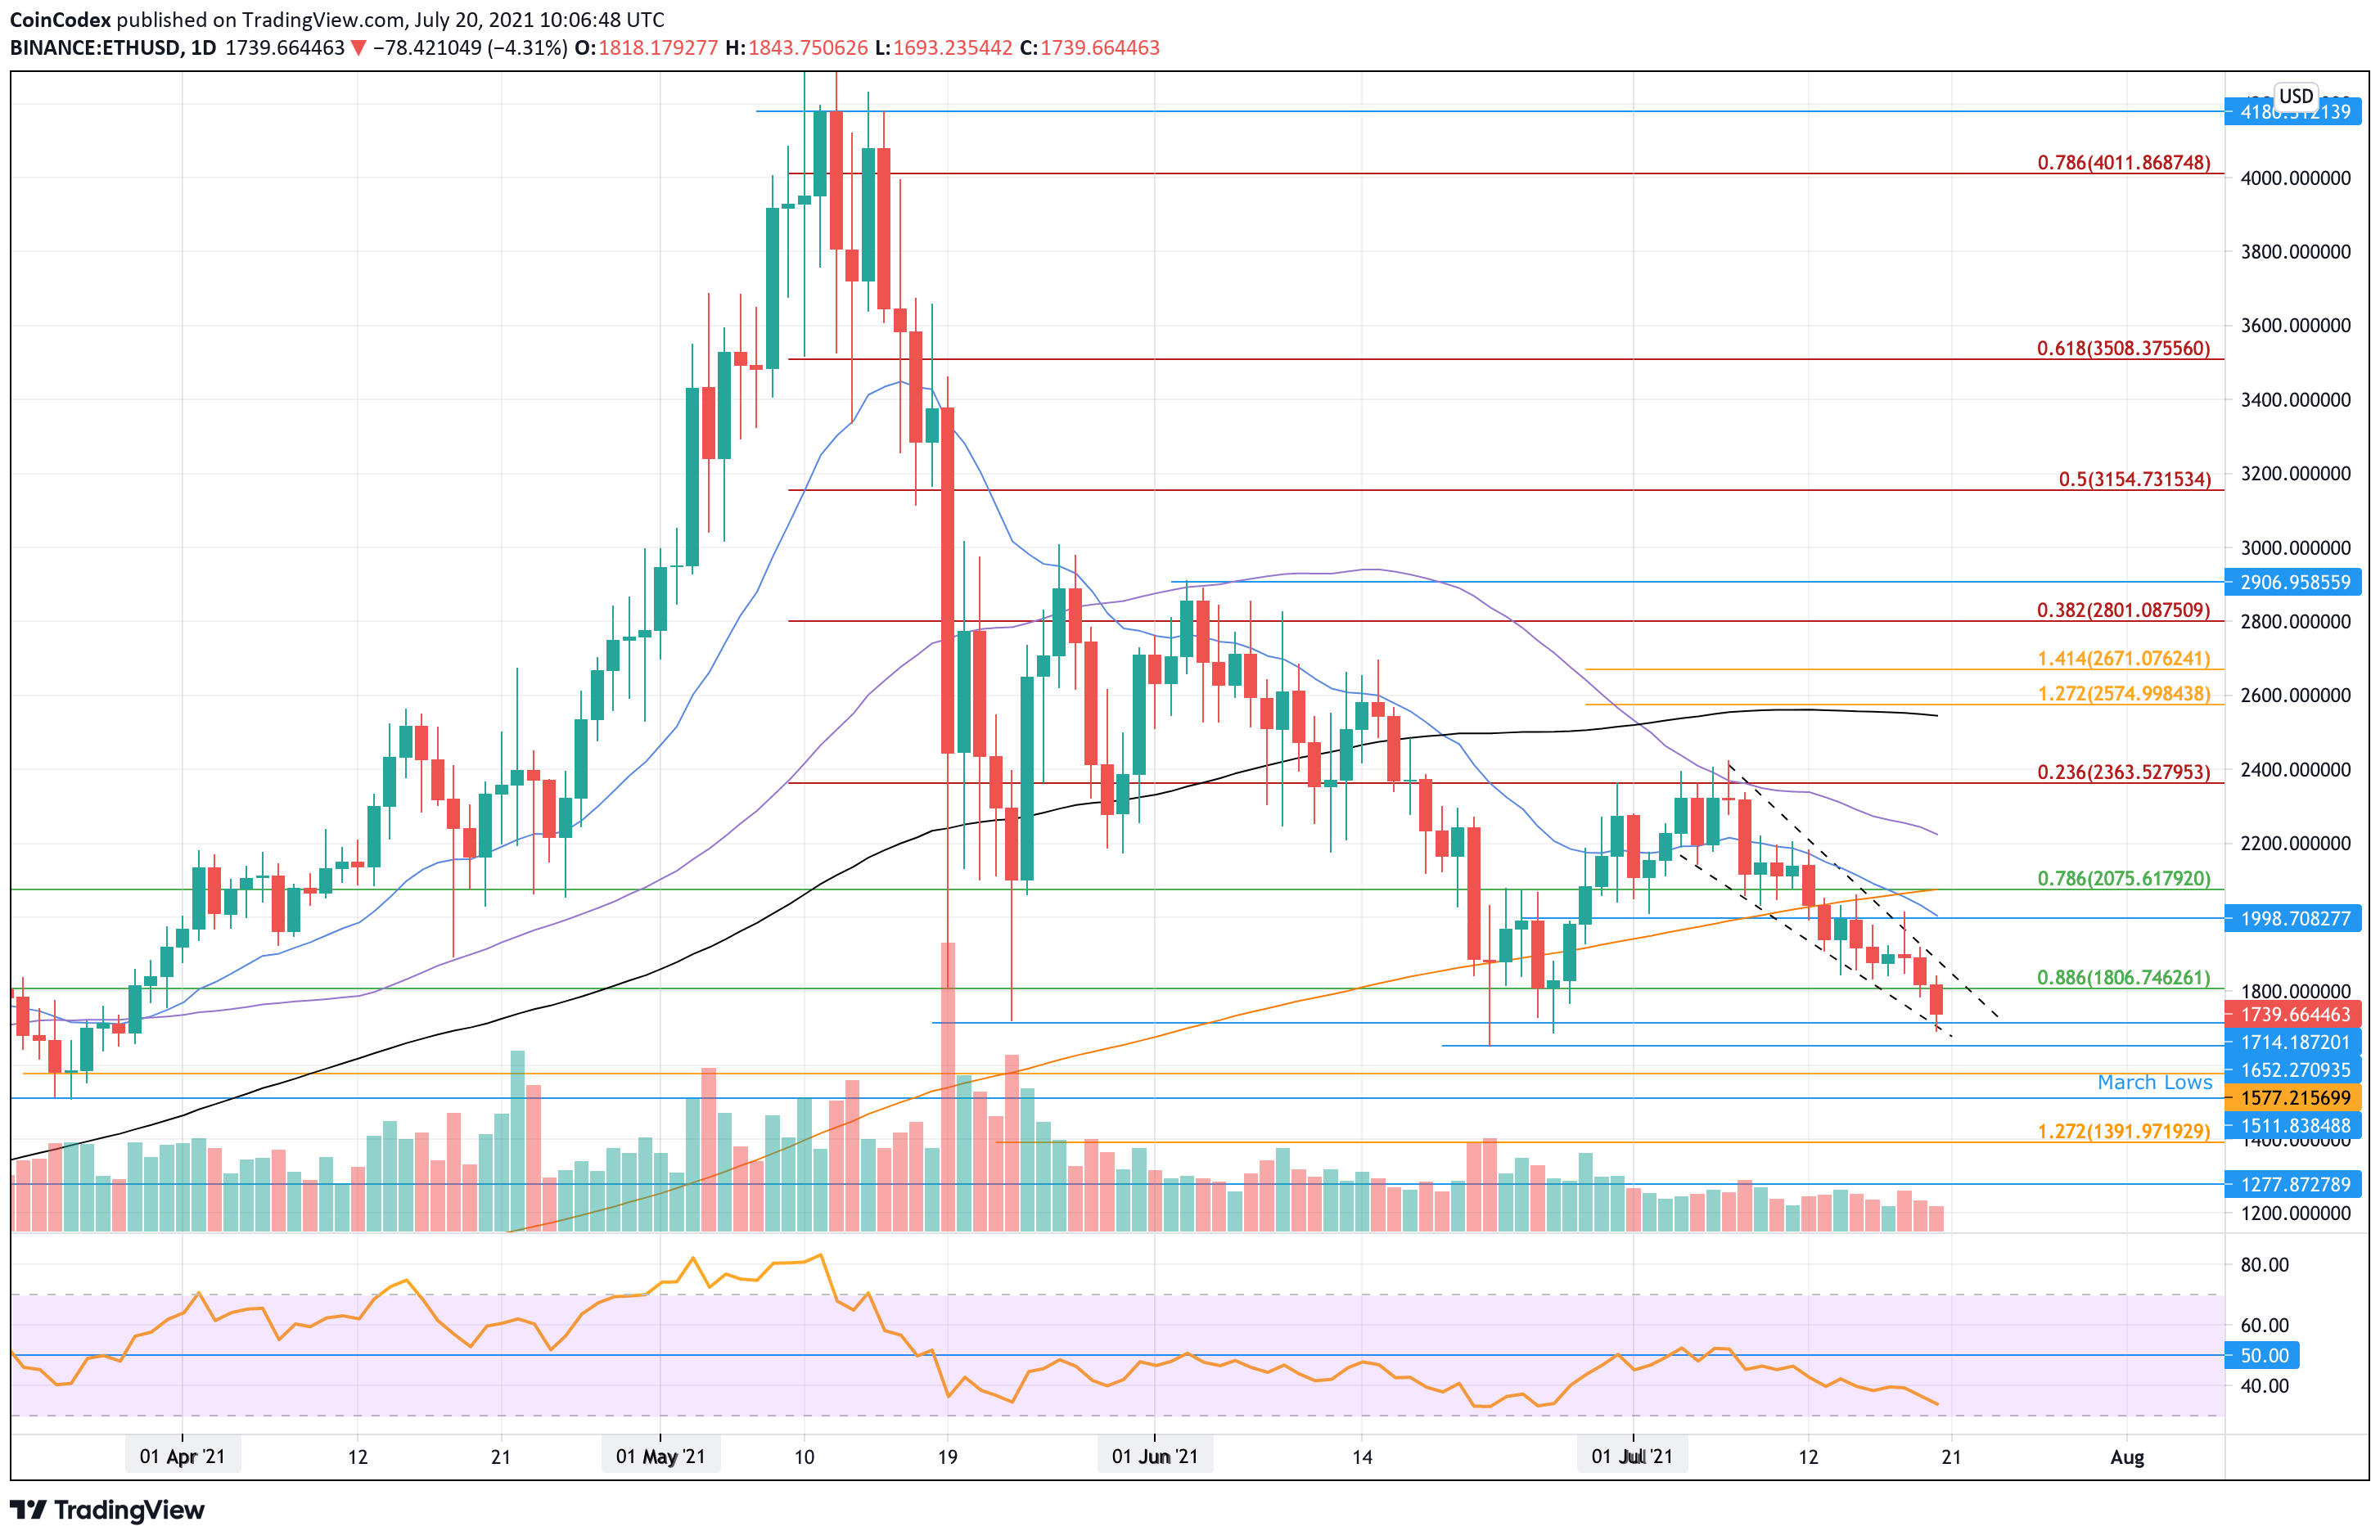
Taking a look at the daily chart above, we can clearly see the breakdown in price action through July. The cryptocurrency found support at $1,800 (.886 Fib Retracement) toward the end of June and rebounded higher from there. Unfortunately, ETH was unable to break resistance at $2,365 at the start of July, provided by a 50-day MA and a bearish .236 Fib Retracement.
It rolled over from there and started to head lower inside the current descending wedge formation that has formed. Toward the middle of July, ETH fell beneath the 200-day MA and continued to head lower.
Today’s 7% price fall has now caused ETH to drop beneath $1,800 and reach as low as $1,700 today. If today’s daily candle was to close beneath $1,800, it would produce the lowest daily candle closing price since March.
Ethereum price short-term prediction: Bearish
Unfortunately, the break beneath the $1,800 level has turned ETH bearish in the short term. We would still need a daily candle closing beneath $1,800 to confirm the break, but it is looking highly likely. To turn neutral, ETH would have to break back above $1,800. ETH would need to continue higher and break the resistance at $2,365 (July highs) to turn bullish.
Looking ahead, the first support lies at $1,715, the lower angle of the descending wedge formation. This is filled by support at $1,700, $1,650 (June lows), $1,600, and $1,577.
Additional support then lies at $1,510 (March lows), $1,500, and $1,455 (downside 1.272 Fib Extension).
Where is the resistance toward the upside?
On the other side, the first resistance now lies at $1,800. This is followed by $1,900 (upper angle of the wedge), $2,000 (20-day MA), $2,075 (200-day MA), $2,200, and $2,365 (bearish .236 Fib & July highs).
ETH/BTC price analysis
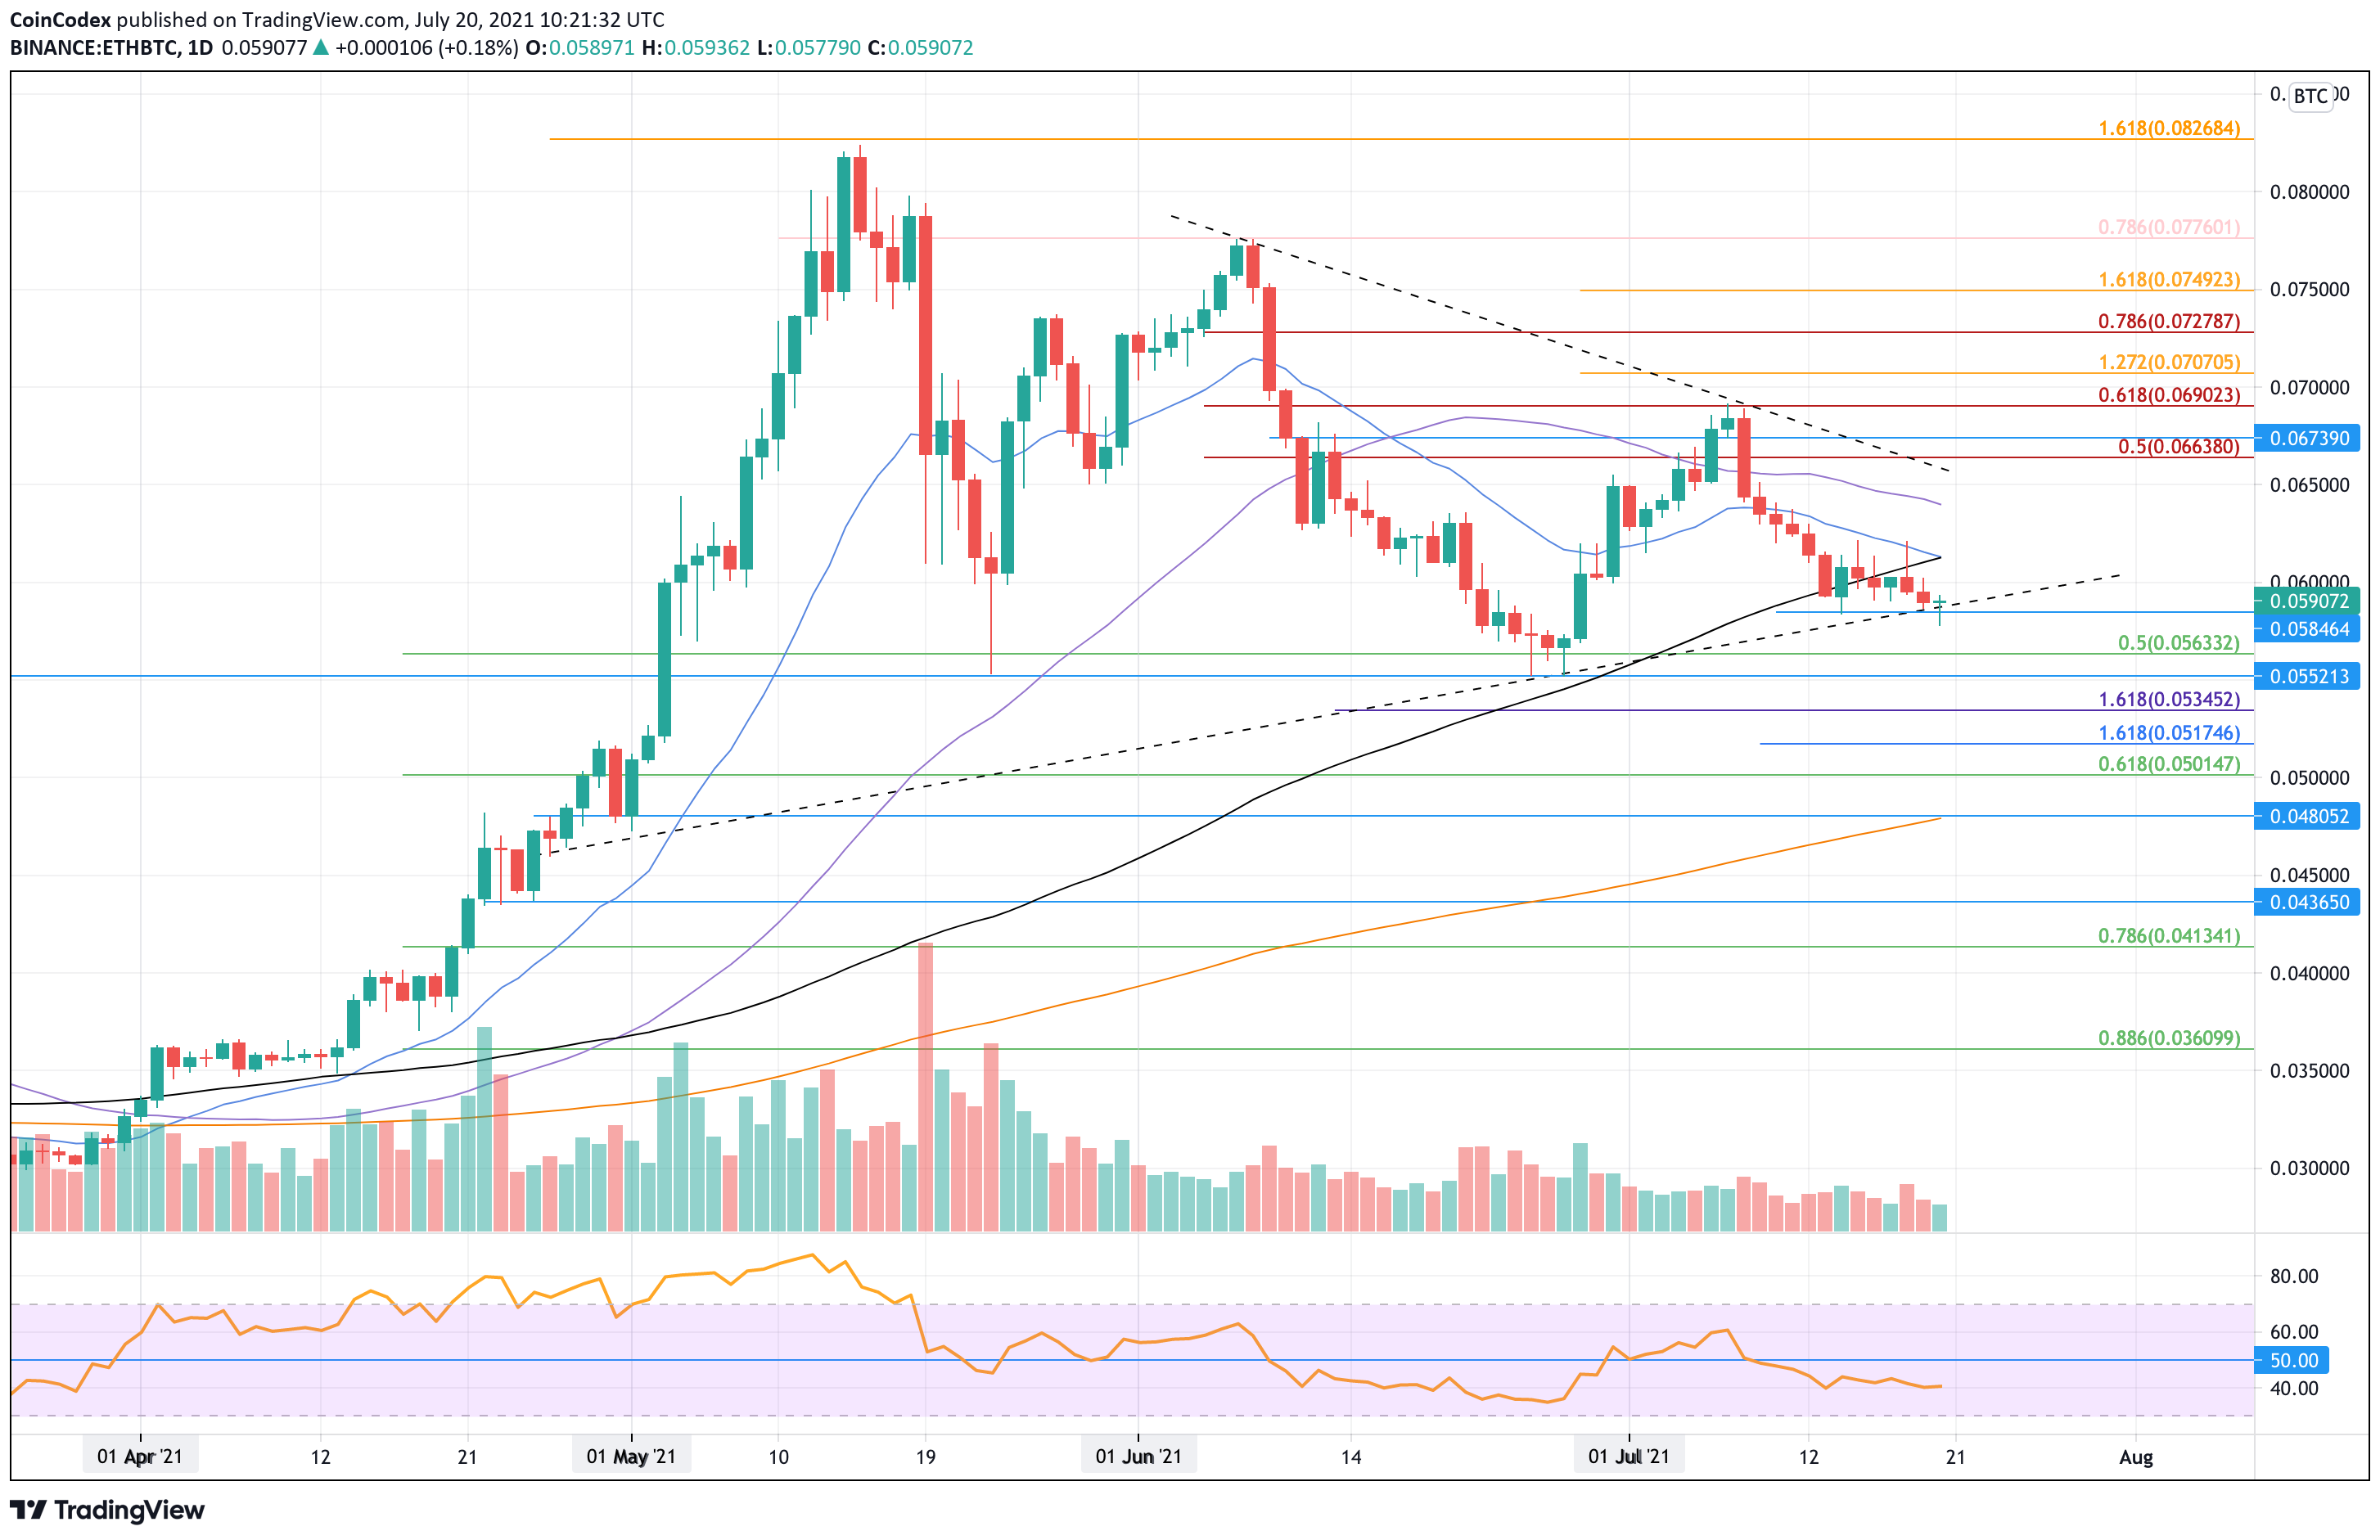
What has been going on?
Ethereum also seems to be heading lower against BTC as it creates a new July low today beneath ₿0.059. The coin found resistance at ₿0.069 at the start of July and has been in a steady decline ever since.
Support at ₿0.059 is provided by a long-term rising trend line that dates back to April, and it also forms the lower boundary of a wide symmetrical triangle pattern. A break beneath here would signal a move lower to the June lows at ₿0.055.
Ethereum price short-term prediction: Neutral
ETH remains neutral until it breaks beneath the June lows at around ₿0.055, at which point it would turn bearish. On the other side, to turn bullish, ETH would need to clear the July resistance at around ₿0.069 (bearish .618 Fib Retracement).
Looking ahead, if the support around ₿0.059 breaks, the first support lies at ₿0.056 (.5 Fib Retracement). This is followed by ₿0.055 (June lows), ₿0.053 (downside 1.618 Fib Extnesion), ₿0.0517 (short-term downside 1.618 Fib Extension), ₿0.05 (.618 Fib), and ₿0.048 (200-day MA).
Where is the resistance toward the upside?
On the other side, the first resistance lies at ₿0.06. This is followed by ₿0.0615 (100-day MA), ₿0.064 (50-day MA), ₿0.066, and ₿0.069 (July resistance).
Keep up to date with the latest ETH price predictions here.