The bear’s unexpected attack on the cryptocurrency market had an adverse impact on a majority of the top coins as most coins are pictured in red at press time, changing the course of the market in a single blow.
Ethereum [ETH], the second-largest cryptocurrency by market cap, also succumbed to the bear’s attack. According to CoinMarketCap, at press time, Ethereum was trading at $139.26 with a market cap of $14.62 billion. The coin recorded a trading volume of $4.38 billion and lost over 5% of its value in the past seven days.
1-hour
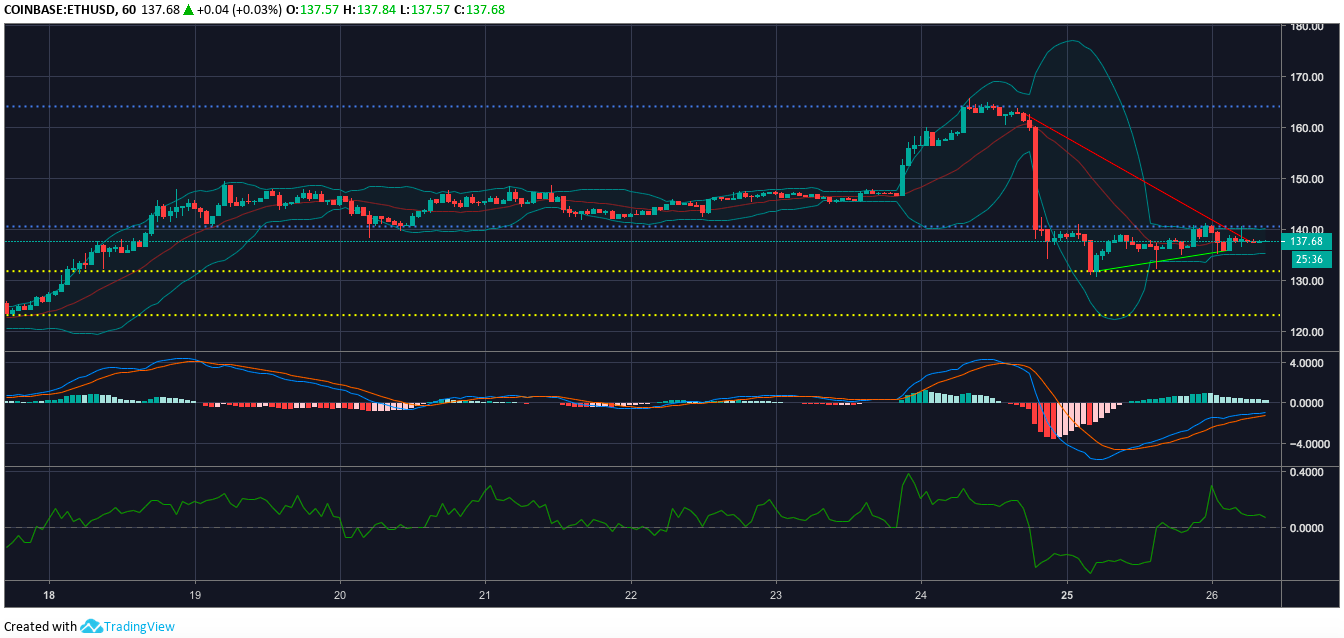
Ethereum one-hour price chart | Source: TradingView
In the one-hour time frame, the downtrend for the cryptocurrency was outlined from $167.79 to $137.85. However, the uptrend for the coin was from $131.76 to $135.90. The cryptocurrency’s immediate resistance was at $140.54 and there was strong resistance at $164.13. The support levels for the coin were laid down at $131.76 and $123.12.
Bollinger Bands forecasted a decrease in market volatility as the bands were pictured close to each other, making no room for the price candles to move.
MACD showed that the coin will emerge from the bear market soon as the moving average line is pictured on top of the signal line after a crossover. The coin was also supported by the indicator’s histogram as it is pictured in green, suggesting some signs of relief.
The Chaikin Money Flow indicator showed that money is circulating back into the market.
1-day
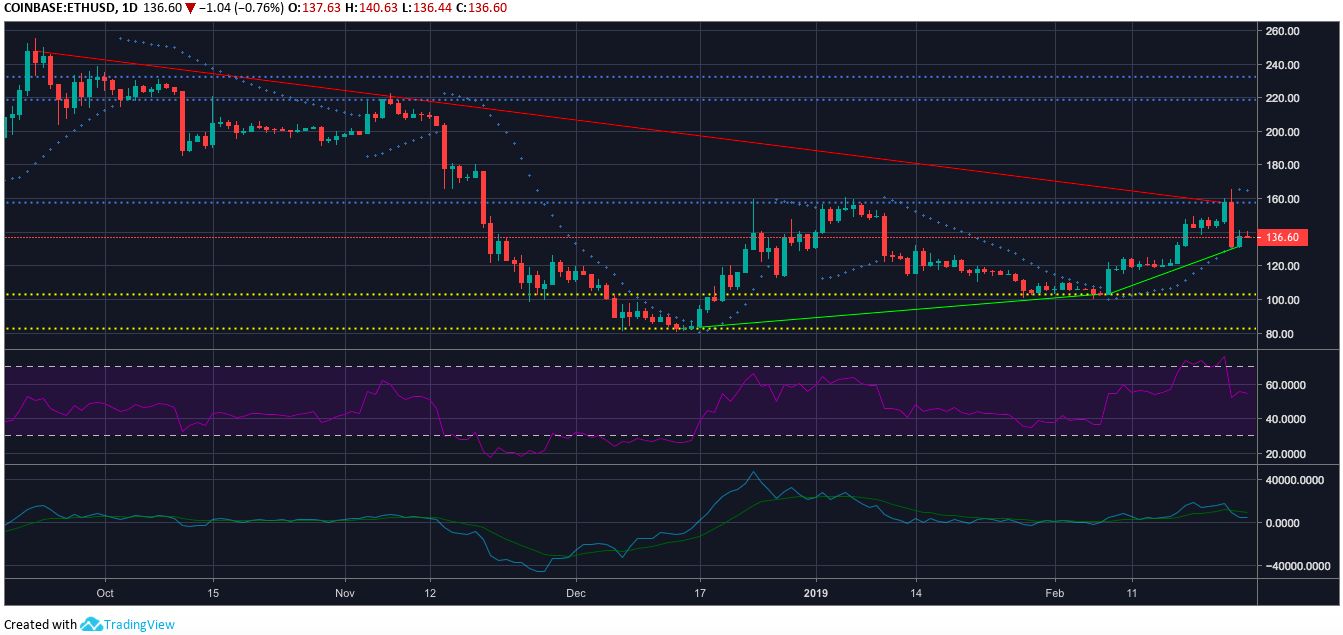
Ethereum one-day price chart | Source: TradingView
The one-day chart demonstrated a downtrend from $247.76 to $157.56 for the second-largest cryptocurrency. Uptrends were recorded from $83.51 to $103.21 and from $103.22 to $131.76. The immediate resistance for the cryptocurrency was at $157.63 and there was strong resistance at $232.41. On the other hand, the immediate support was at $103.04 and the strong support was found at $82.72.
RSI indicated that the selling and buying pressures were in equilibrium.
The Parabolic SAR indicated a bearish market after the recent plunge caused the dotted markers to align above the candlesticks.
Klinger Oscillator however, continued to forecast a bullish market as the reading line was placed above the signal line after a crossover.
Conclusion
Despite the bear’s massive hit on the cryptocurrency market, Ethereum was seen making an effort to regain its status in the cryptosphere. At press time, the coin was supported by MACD and CMF from the one-hour chart and the Klinger Oscillator from the one-day chart.