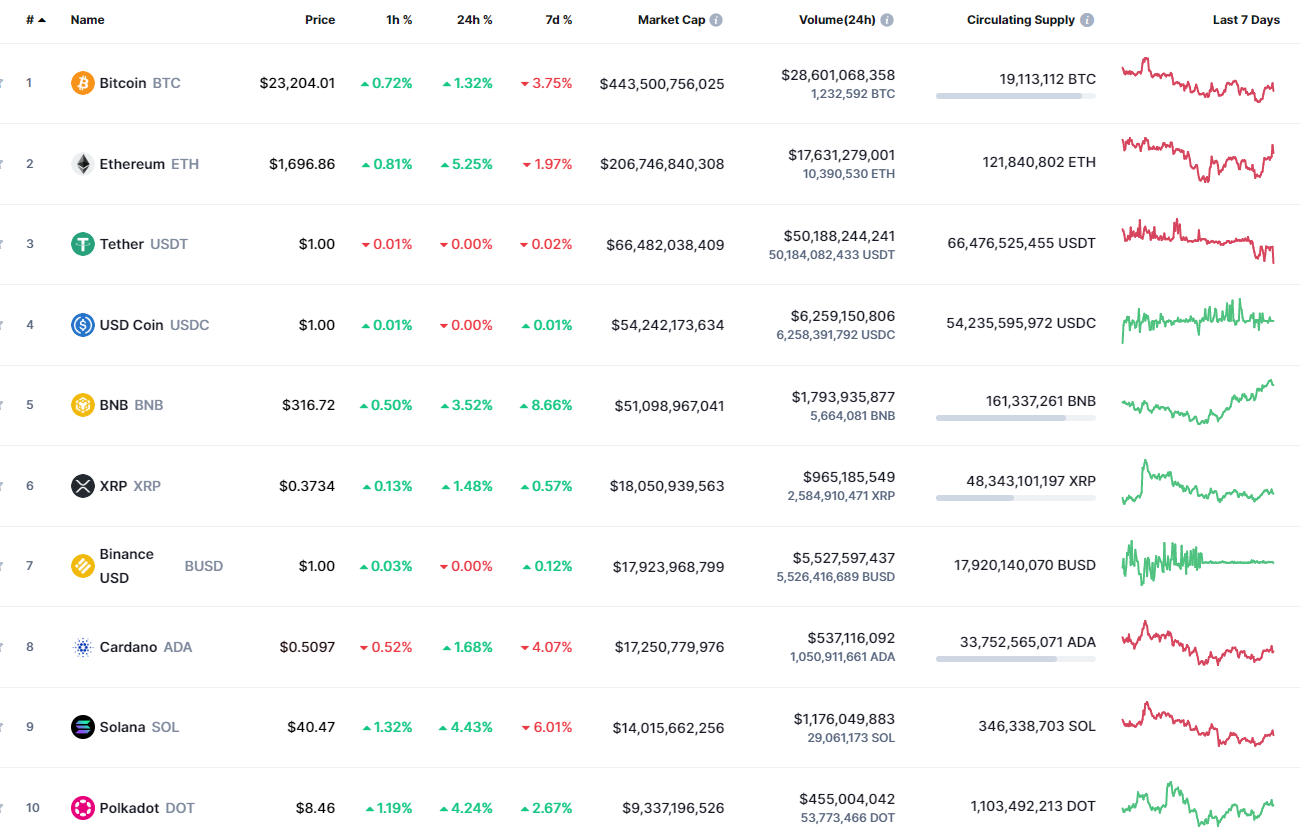
Bulls keep setting coins to new local peaks, according to CoinMarketCap rankings.
BTC/USD
The rate of Bitcoin (BTC) has risen by 1.32% over the last 24 hours.
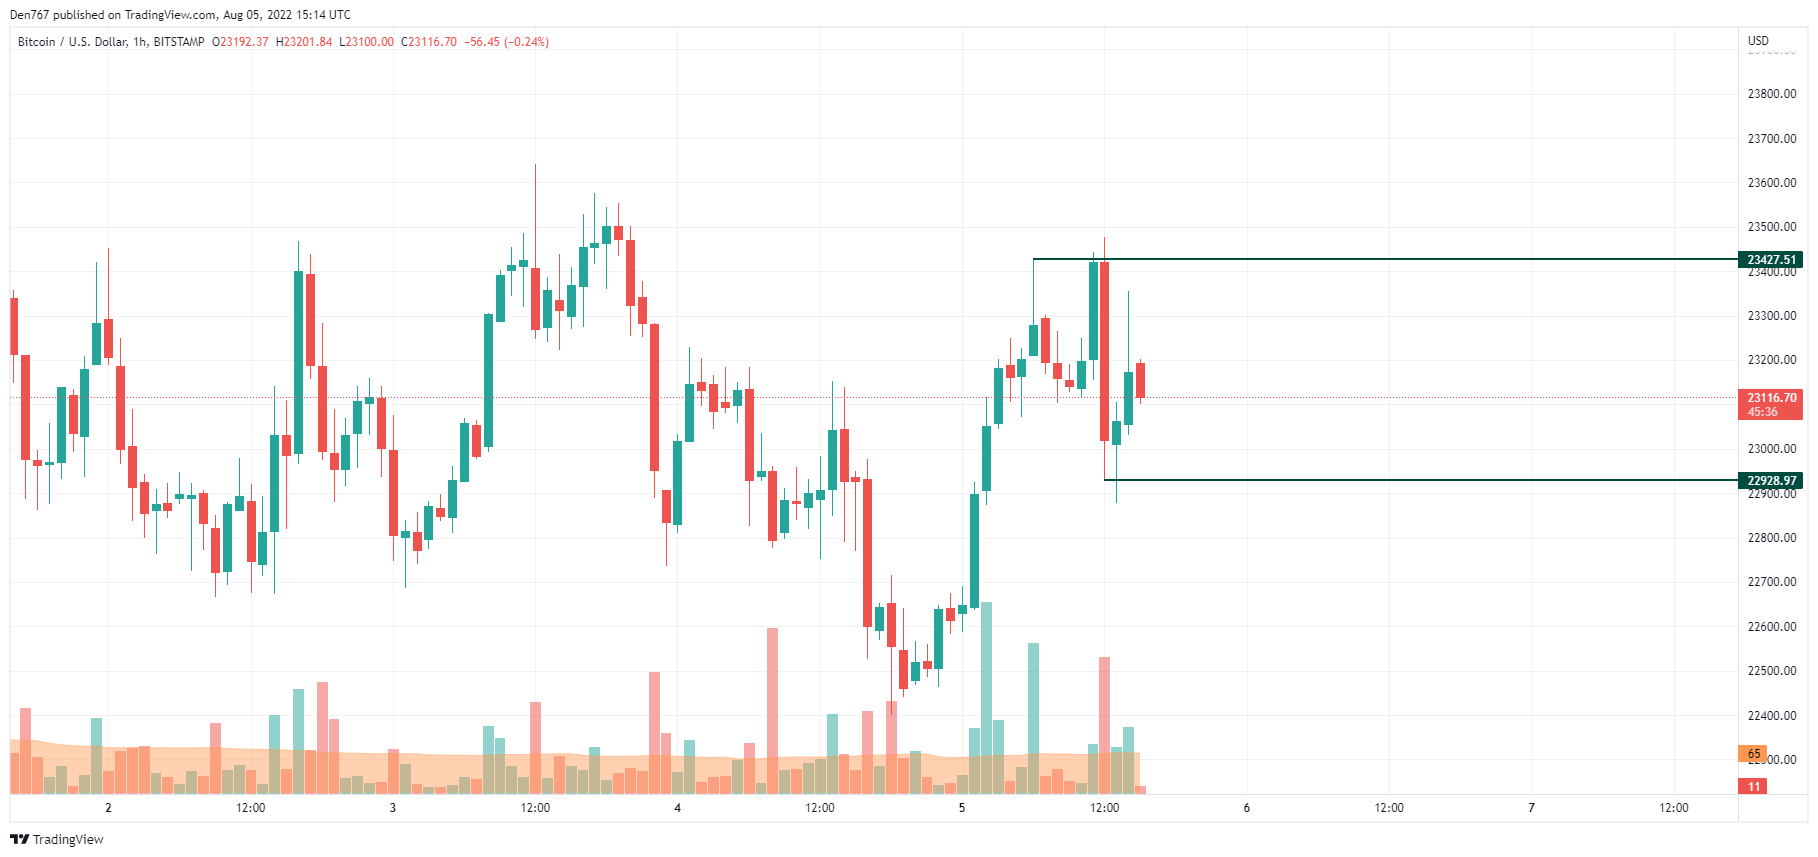
On the local chart, Bitcoin (BTC) is stuck between the support level at $22,928 and the resistance at $23,427.
The volume has declined, which means that one should not expect any sharp moves until the end of the day.
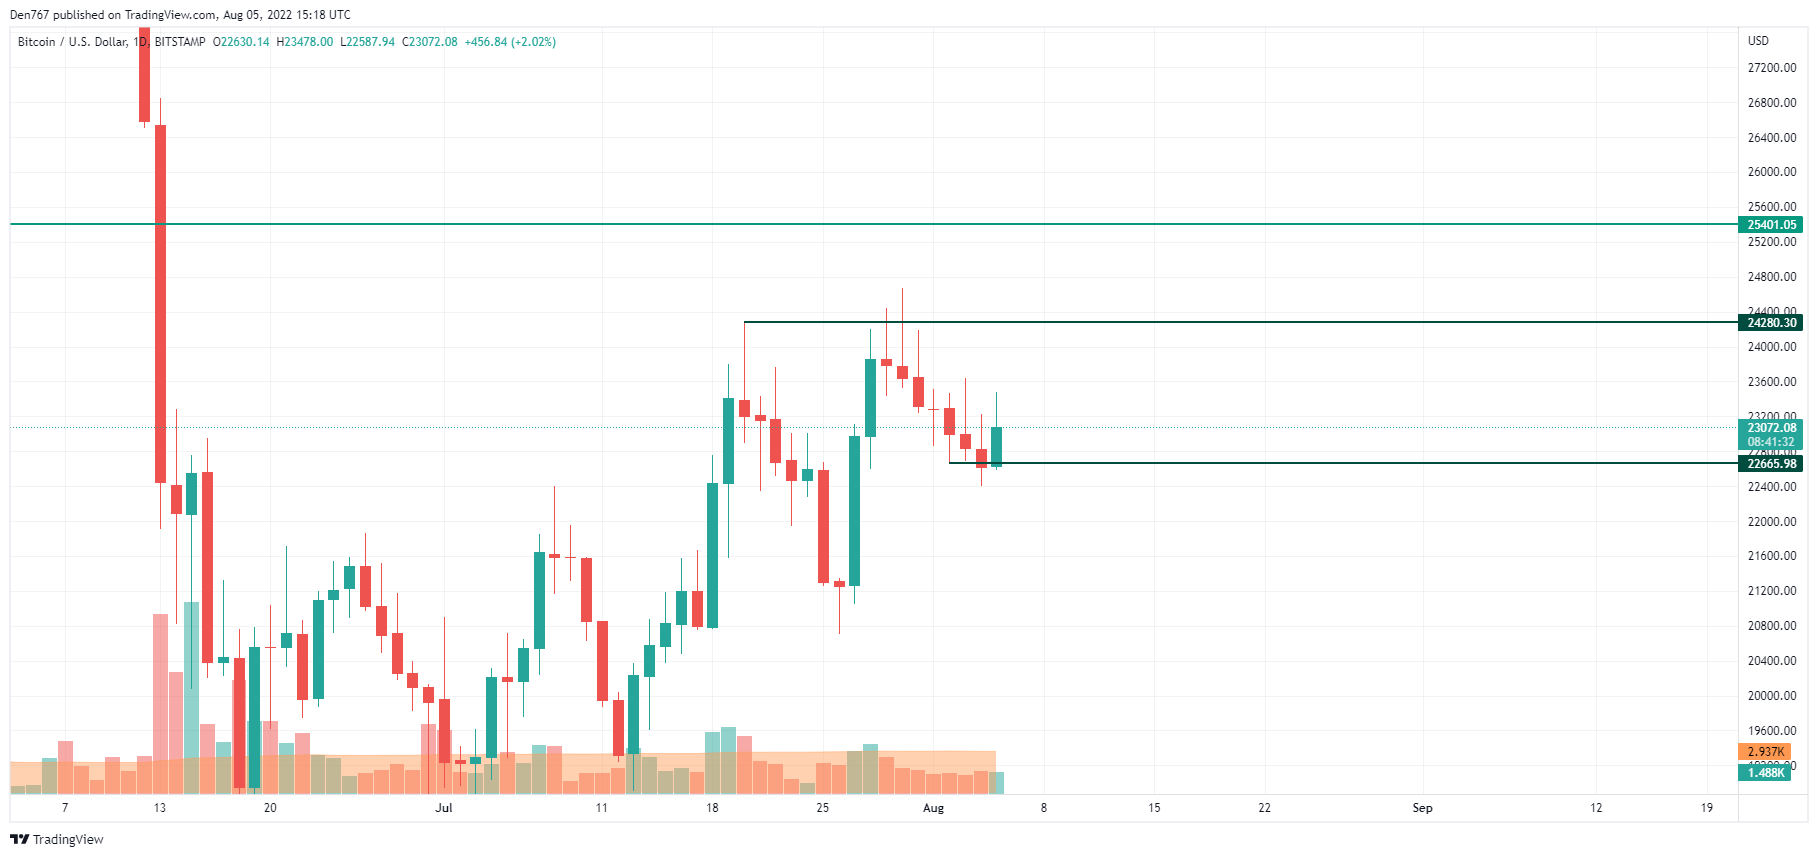
On the daily time frame, Bitcoin (BTC) is again trading above the vital $23,000 mark. If buyers can hold this level, there are high chances to see the test of the $24,000 zone next week.
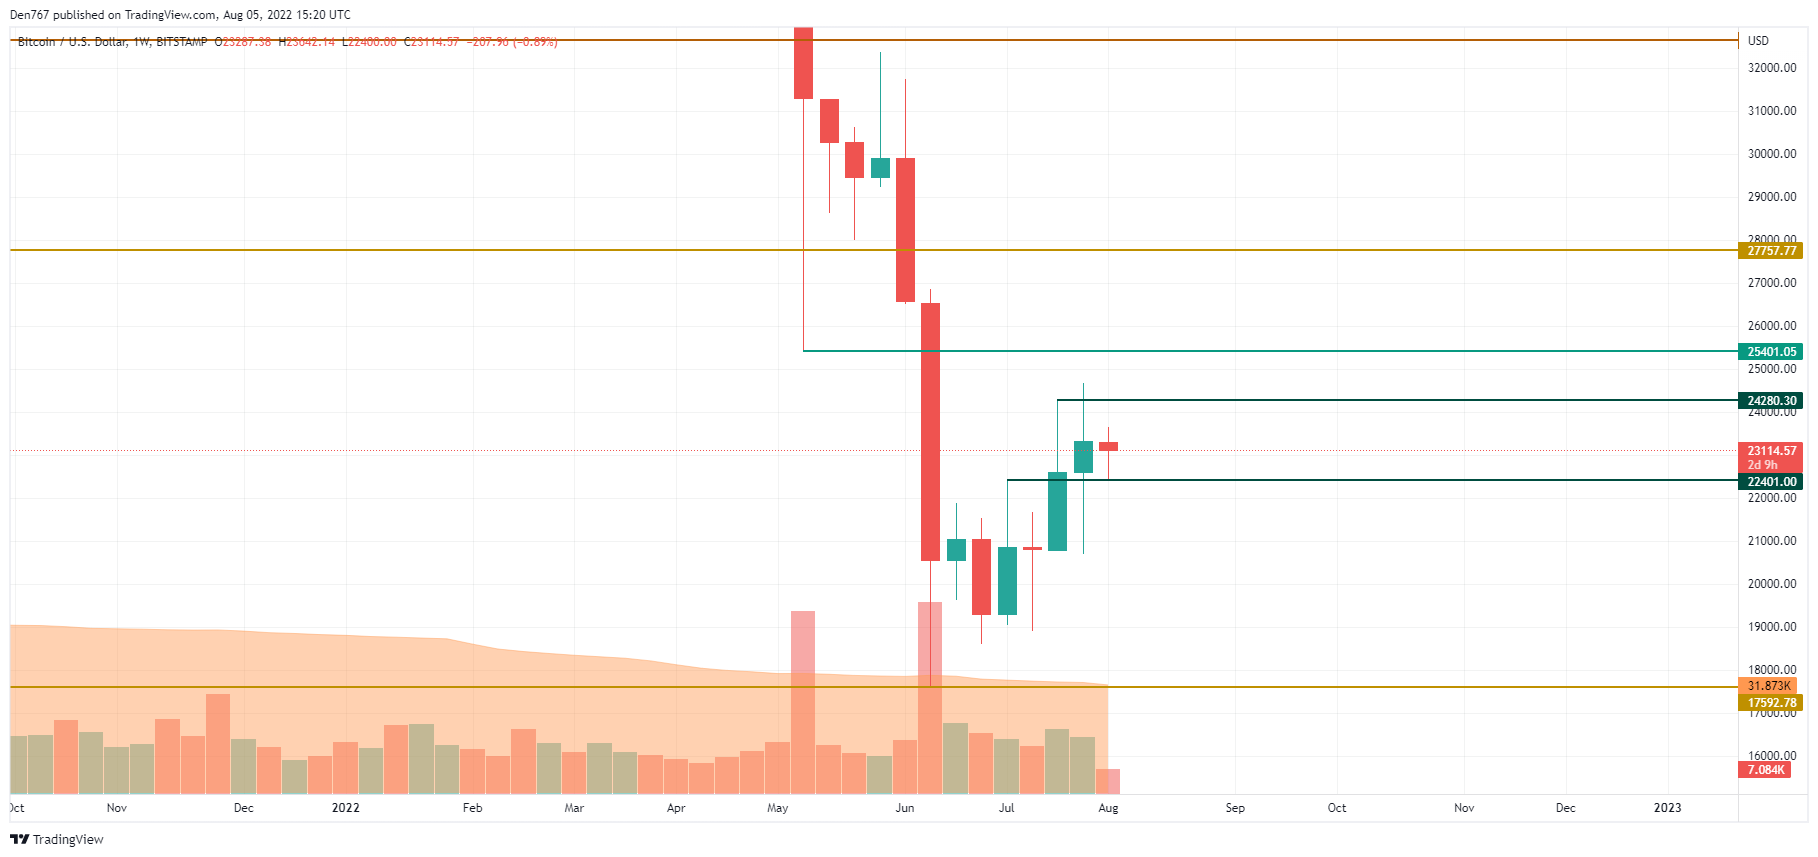
From the mid-term point of view, Bitcoin (BTC) has bounced off the $22,400 mark, confirming bulls' power. However, the main coin might need more time to accumulate energy for a further upward move.
Bitcoin is trading at $23,108 at press time.