Bitcoin price analysis displays recovery going on the hourly charts. The BTC/USD pair is now hovering near $23,230 level and is posting higher lows on the charts. The only concern that bothers the day traders is the lack of volume which can threaten the current uptick in the price. The traders are looking for more conviction in this rally and, thus, are sitting on the side lines. Institutional buyers are not taking active part currently.
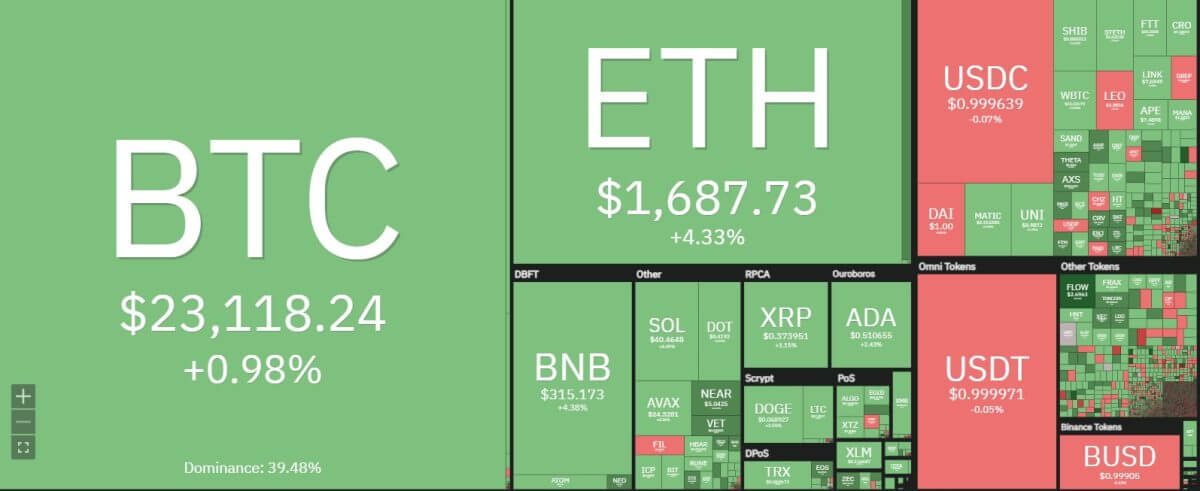 Source: Coin360
The equities are trading relatively higher on the back of the Fed decision and higher earnings. The reverse from $24,500 level shows that the buying impulse is not strong and the buyers are not on sure footing. The consolidation is certainly leading higher as the pair is gradually moving towards higher levels. The pair will first pressure at the 50-day EMA where any decisive purchase will be more evident in the volume data.
BTC
Bitcoin price analysis in the last 24 hours: Neutral with a higher bias
There are not any aggressive bids in the market right now which can spur up the confidence. The rebound is moving up gradually and the BTC/USD pair is ending consolidation without any big bang. The rise from $18,900 is certainly helping the positive sentiment. The swing high at $24,000 has been a tough cookie to crack and the corrective pullback is limiting the BTC/USD’s higher side potential.
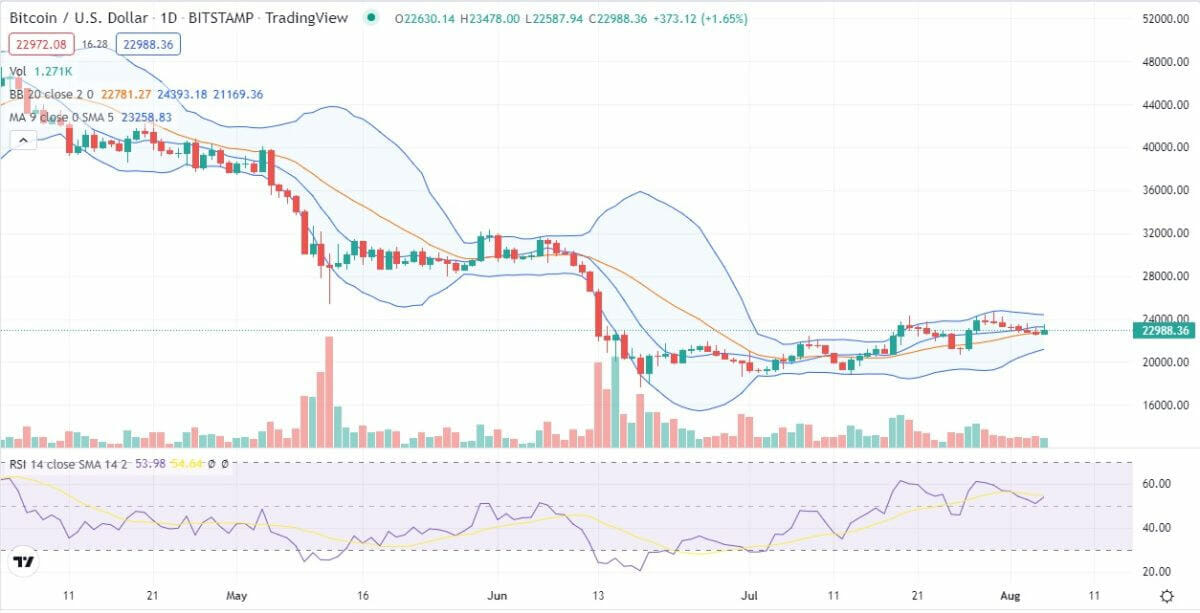
 Source: TradingView
The Bitcoin price analysis is showing that the pullback is losing steam as well. The daily charts may have to settle down somewhere near $23,000 so that BTC can go higher in a healthy manner. The resistance region near $23,400 is also holding the price down. The pair needs to close above this level decisively in order to grow higher and possibly go beyond $25,000 psychological level.
BTC/USD 4-hour price chart: Bearish flag pattern threatens pullback
The scenario on the hourly charts is giving away mixed signals. The Bitcoin price analysis on the hourly timeframe shows bearish flag pattern near the higher trendline. The pair can be rejected again as the continuation pattern can result in the pair falling lower. If the price does break lower, the BTC/USD pair can move towards $21,750 in a swift manner as per Bitcoin price analysis.
 Source: TradingView
The current price action can be called choppy with a higher bias. The weekend is unlikely to change the pattern as the volumes decrease and no clear direction emerges from the current trend. The RSI is stagnating ear 50 level and complicating the matters further. The uncertainty in the price movement is evident in MACD indicator as well where the lines are converging.
Bitcoin price analysis conclusion: Positive bias keeps the trader spirit high
The majority of green candlesticks on the charts is contributing to the positive price action. The 20-da exponential moving average and the 50-day exponential moving average are not allowing abundant movement in the price. The bullish sentiment is muted.
A close above the $24,200 level would spice things up a lot. The RSI is certainly above the 50 zone and reach into the overbought territory as the trend gets solidified over the weekend.
Disclaimer. The information provided is not trading advice. Cryptopolitan.com holds no liability for any investments made based on the information provided on this page. We strongly recommend independent research and/or consultation with a qualified professional before making any investment decisions.