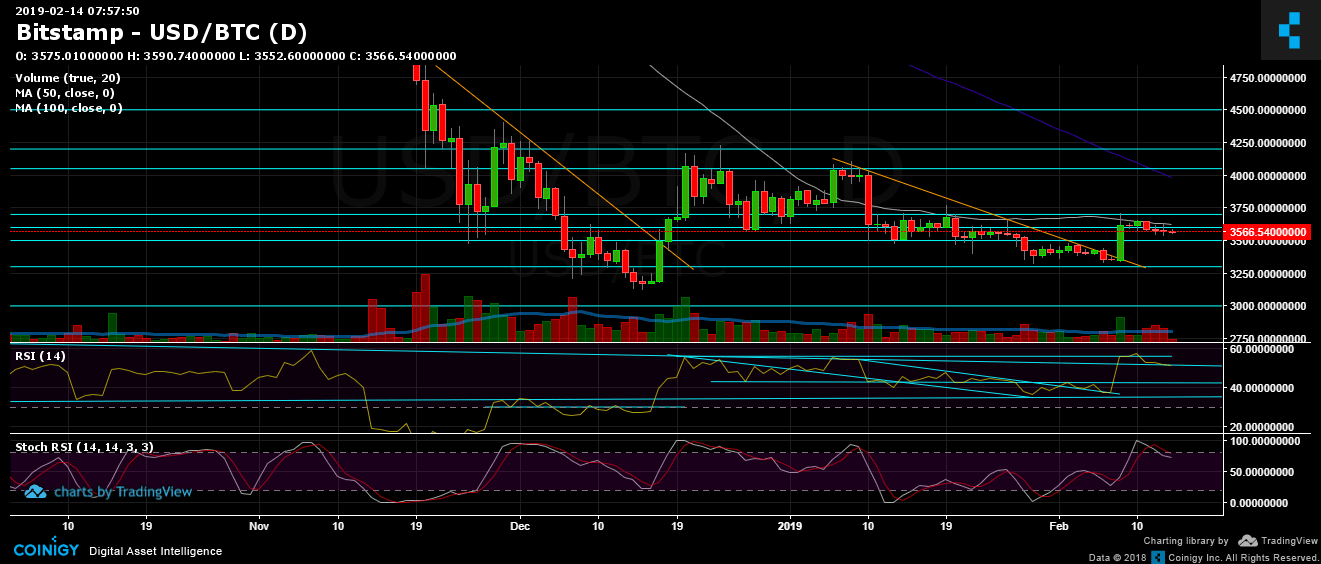
For the past five days, Bitcoin is trading sideways around the Fib level 38.2% retracement ($3575). The bulls, that were expecting to see a reversal, or at least a breakout of the important 50-days moving average line of the daily chart, are still waiting.
We pointed out two days ago an option that the last $300 daily gains of BTC might end up as another Bart Simpson’s head pattern. This scenario is still valid.
Also, the past movements in the BTC short and long open positions set up to support the Bart option. However, there is always the other side, which in my opinion, has lower chances to take place.
Bitcoin Short Positions Are Reaching Long-term support
Over the past 24 hours, BTC the short positions had trimmed by nearly 10%. This is very odd. Whoever did that made sure that the price of Bitcoin wouldn’t move much. At the same time, the BTC long positions had gained momentum.
When looking at the following chart of the BTC shorts (on BitFinex), we notice that the short positions have reached their long-term support trend-line. This line was formed at the beginning of 2018, hence, more than a year ago.
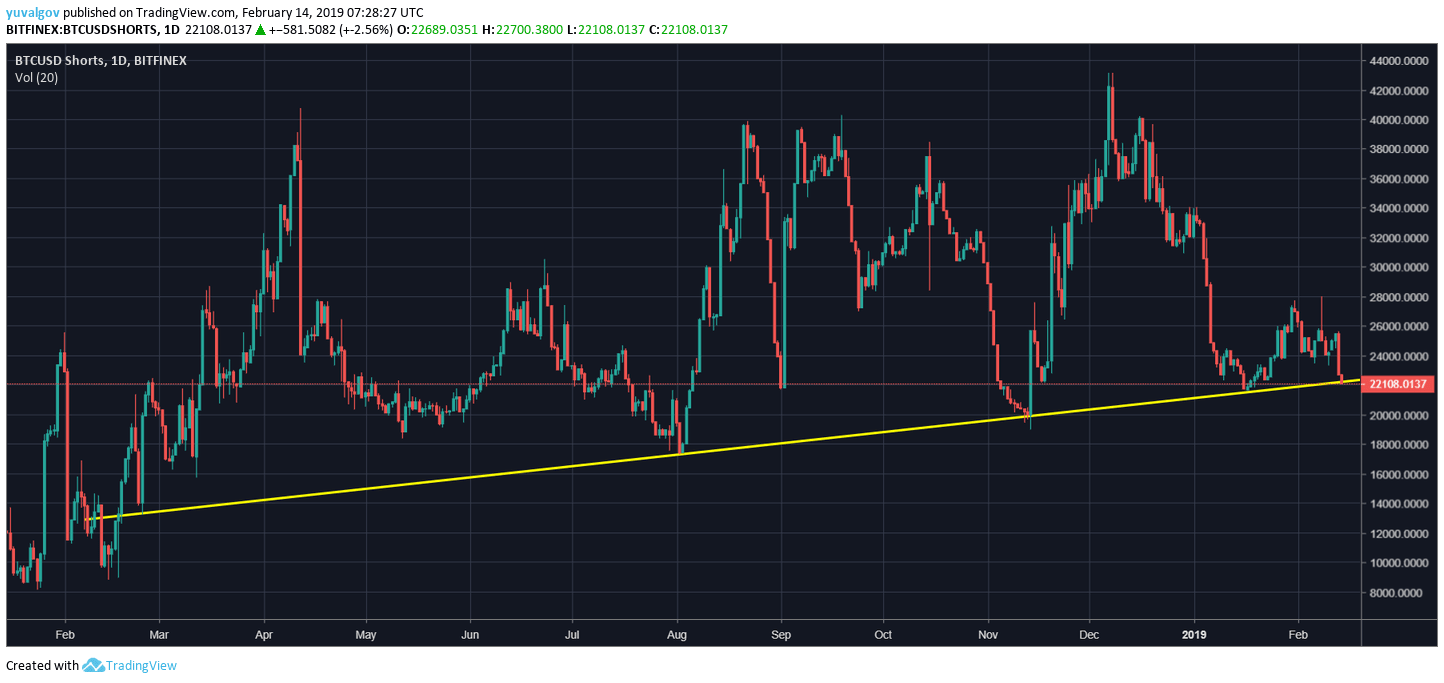
Unlike common sense, when the amount of open shorts is low (and longs are high) – expect a long squeeze. When the amount of open shorts is high – expect a short squeeze.
I’m not advising, but let’s look at the last time this set-up occurred:
January 6, 2019, just five weeks ago: The shorts touched the long-term line, longs were gaining momentum, following Bitcoin gains to $4090. But, it didn’t take long for the manipulation to play out, as Bitcoin recorded a low of $3503 on January 10.
The above is Bart’s head we’ve pointed out on the previous price analysis. Let’s see if this situation will end-up the same.
Looking at the 1-day & 4-hour charts
- The daily chart’s RSI: The RSI has reached support on the long-term descending trend-line. It seems fragile, but the line is still supporting. Stochastic RSI oscillator had recently crossed over on the overbought area. This might be a signal for a correction down for the mid-term.
- Support and resistance areas: Bitcoin had failed to break-up the key-level of the 50 days moving average line (on the daily chart, marked in white). This level currently lies around $3600. A breakout here and the settings might change.
Breaking it up could lead BTC to retest higher resistance levels of $3700, $3800 and $3850.
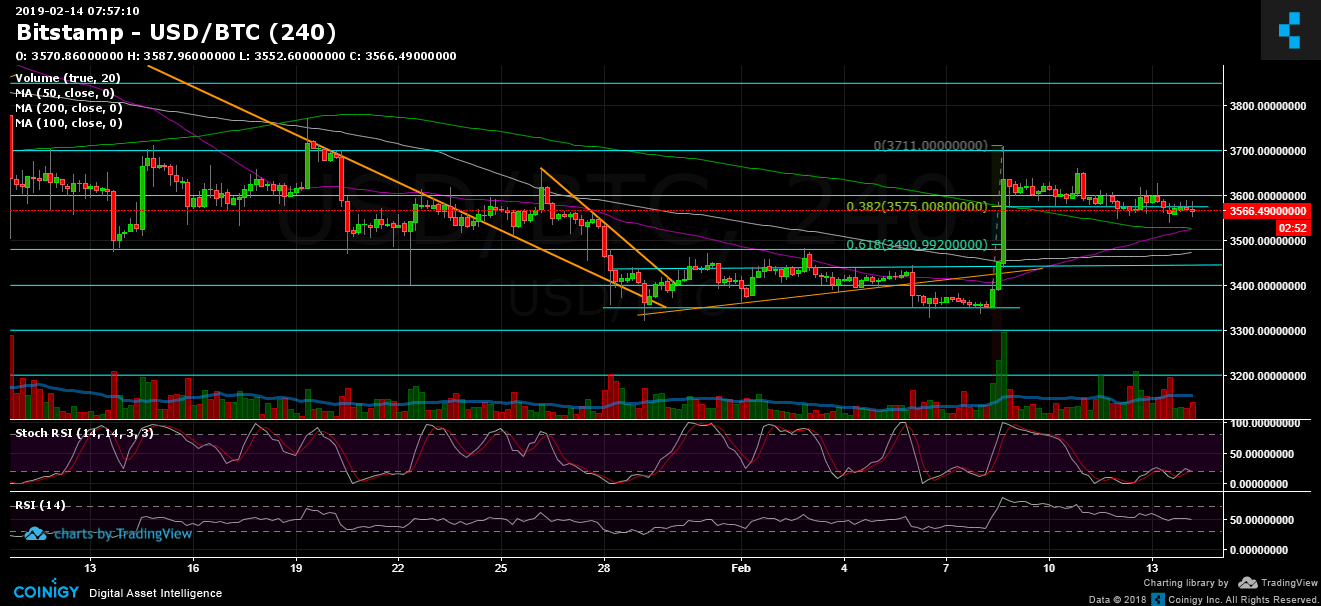
From below, the support area of the current price at Fib level $3575 seems to hold. The next support lies around $5325 with the cross between the 4-hour 50 days moving average and the 200-days moving average lines. The mentioned cross might be a positive sign for Bitcoin. The next significant support area is the $3480 – $3500 strong resistance turned support zone. Further lies the $3400 level. - Another thing to mention is the amount of volume. It seems that the volume is quite high, keeping in mind the consolidation of Bitcoin.
- As mentioned, BitFinex’s open short positions sharply decreased to 22.50K BTC of open positions, following the analysis above.
BTC/USD BitStamp 4-Hour chart
BTC/USD BitStamp 1-Day chart