Bitcoin’s price has rebounded from the $20K area, making a couple of higher highs and lows. This type of structure can indicate that the market is finally beginning to see an uptrend. It is also increasing the positive sentiment across the futures market.
On-Chain Analysis
By: Edris
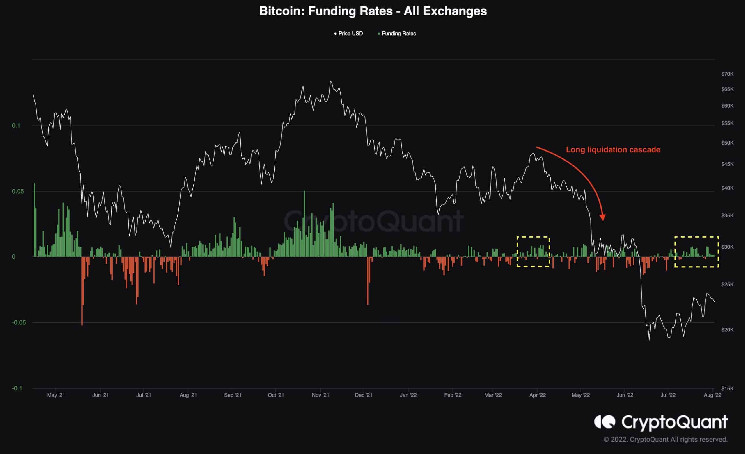
Bitcoin Funding Rates
The funding rates – a very useful metric to identify the futures market sentiment – have been printing positive values over the last few weeks. All this leads to the dominance of bullish sentiment in the futures market. Despite the bullish market structure and the current short-term increase in price, the macroeconomic and geopolitical picture is presently fixed in tension. Anxieties of another war in the east are causing ripple effects.
Ultimately, the current positive funding rates could be a curse, as seen in early April 2022. They could lead to a long squeeze and a subsequent liquidation cascade, leading to another significant drop, alongside a bearish continuation below the $20K mark. Hence, it wouldn’t be wise to rule out the bearish scenario completely, as higher funding rates could lead to more volatility in the short term.
Technical Analysis
By: Edris
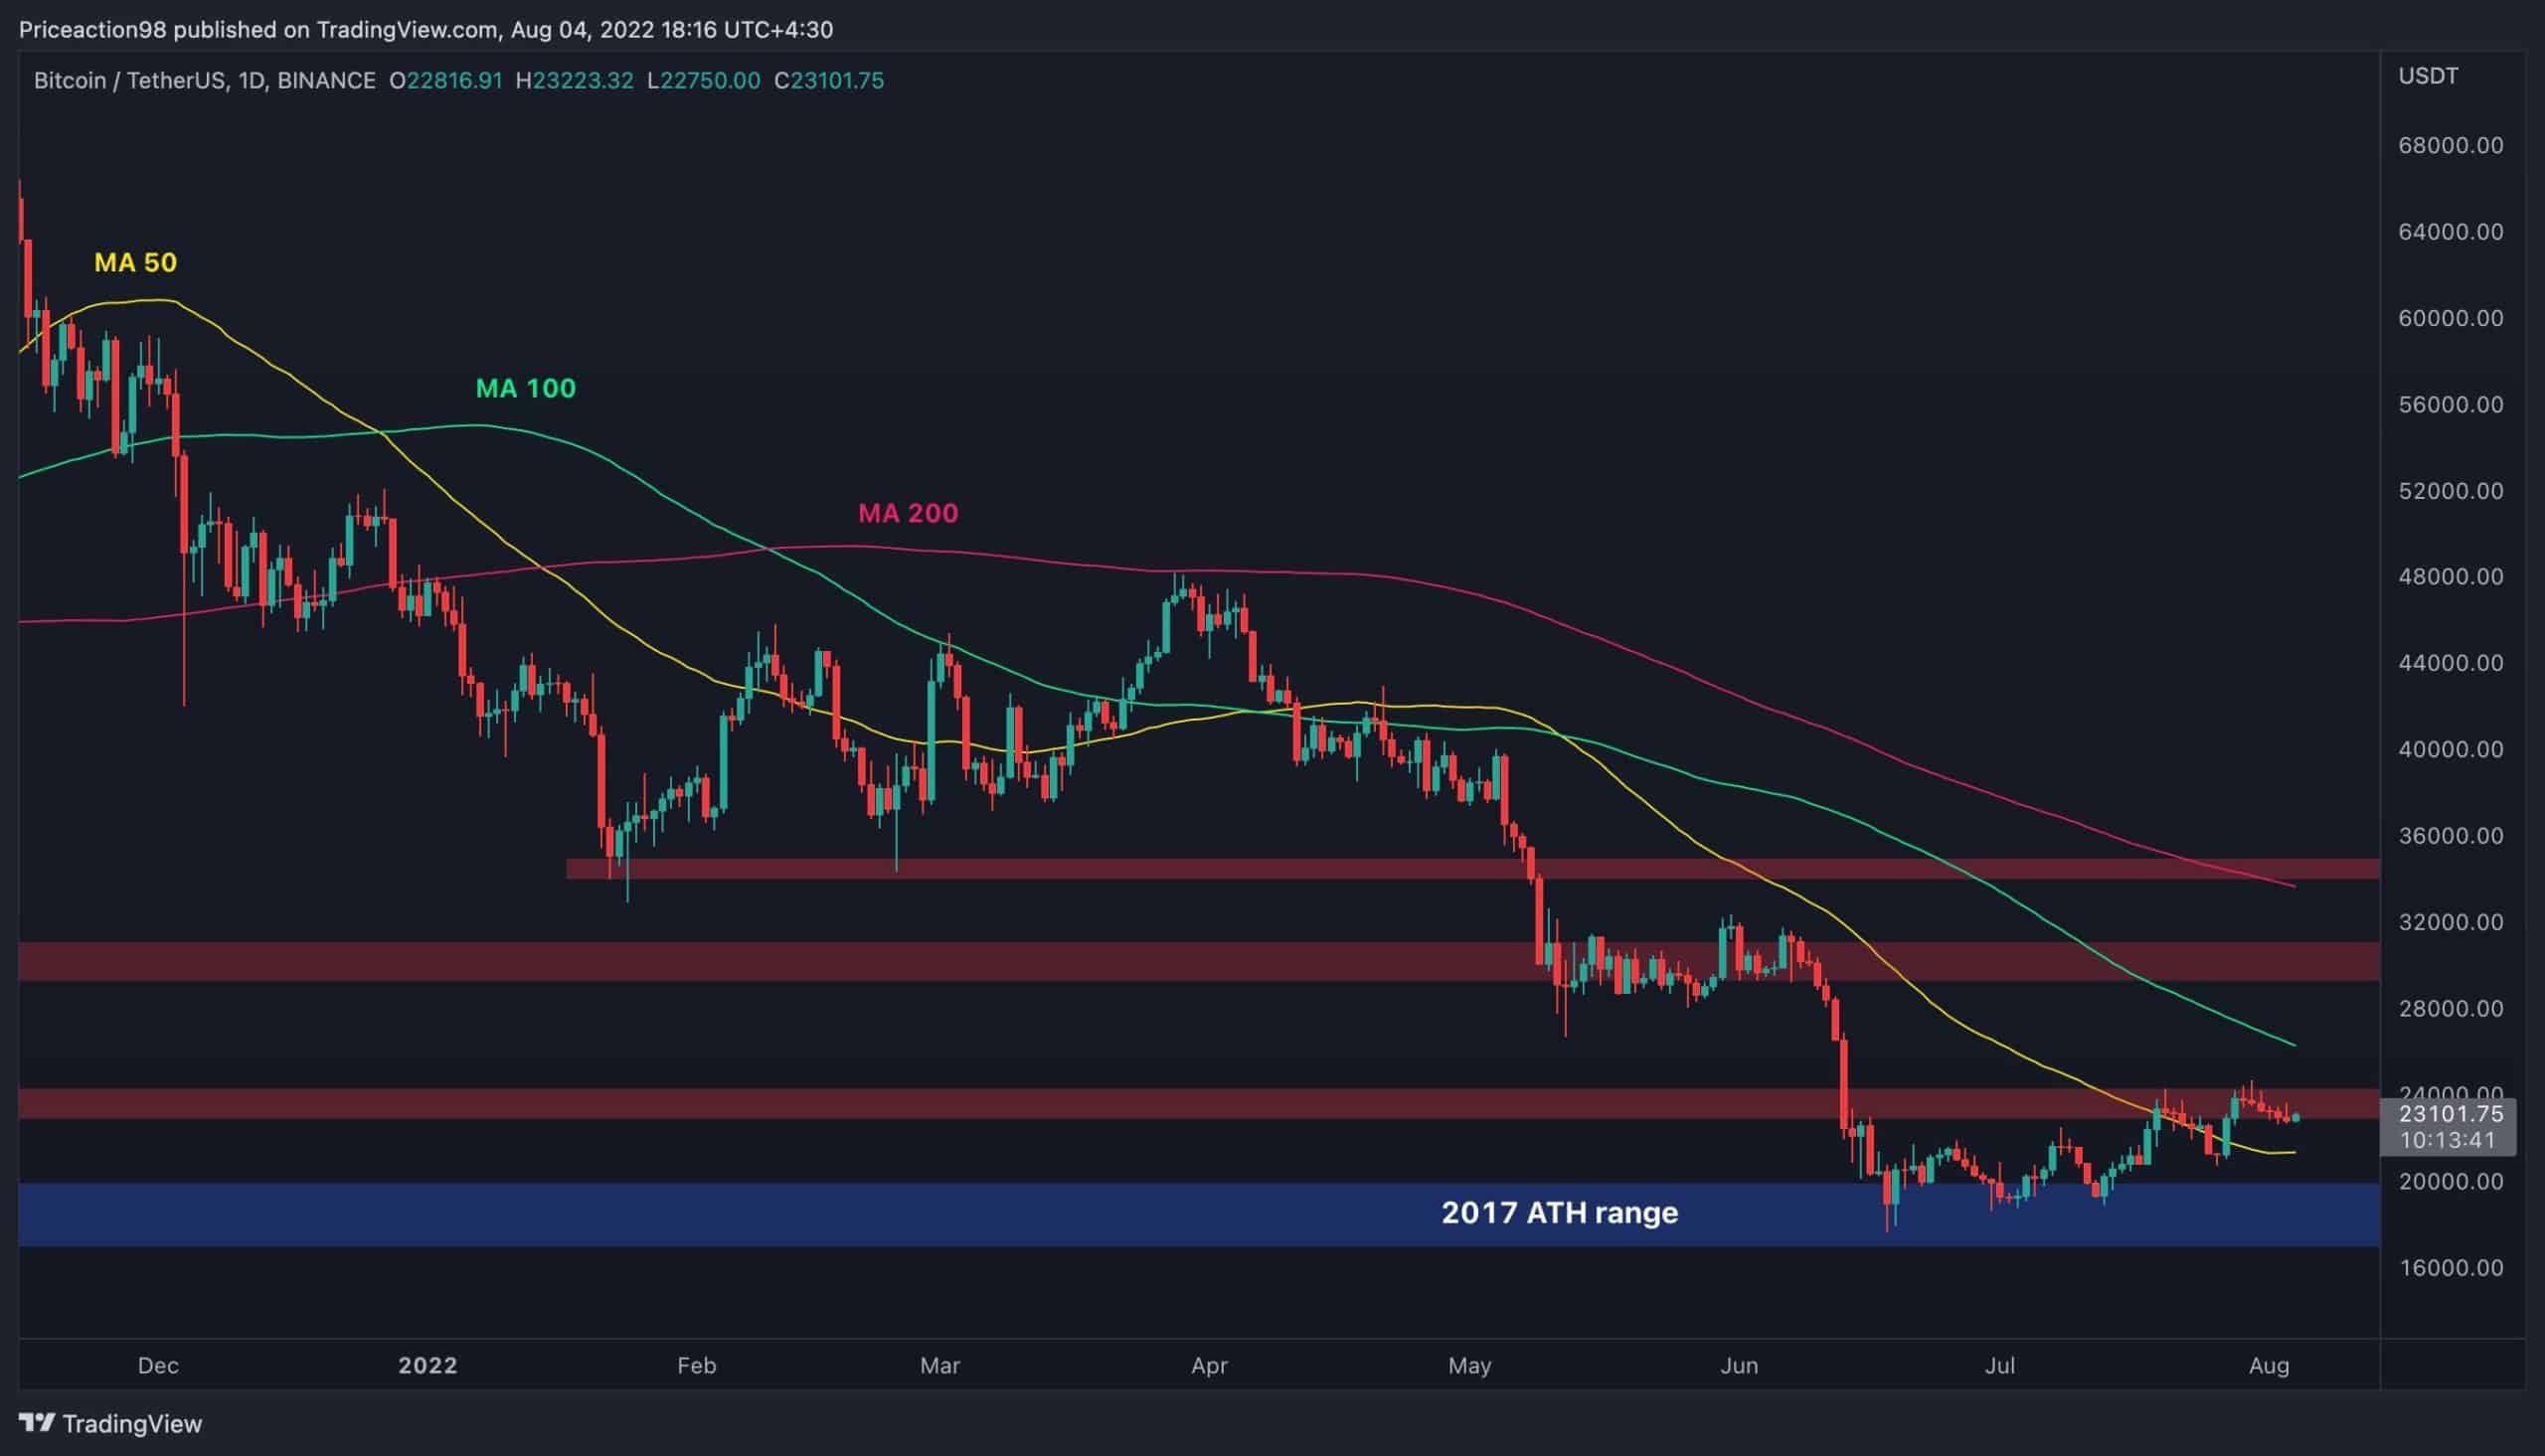
The Daily Chart
Bitcoin’s lengthy downtrend has come to a halt over the last few weeks, as the price has been supported multiple times at the $17K-$20K range of the 2017 all-time high. BTC has been struggling with the $24K resistance level recently, after breaking above the 50-day moving average for the first time since April.
If the cryptocurrency finally breaks the $24K level to the upside, the 100-day moving average would be the first obstacle before the $30K supply zone. Alternatively, if the price fails to break above the $24K area, the 50-day moving average could now act as a support. Regarding next week, all eyes will likely be fixed on the $24K mark, as the price action in this area would determine the market trend in the short term.
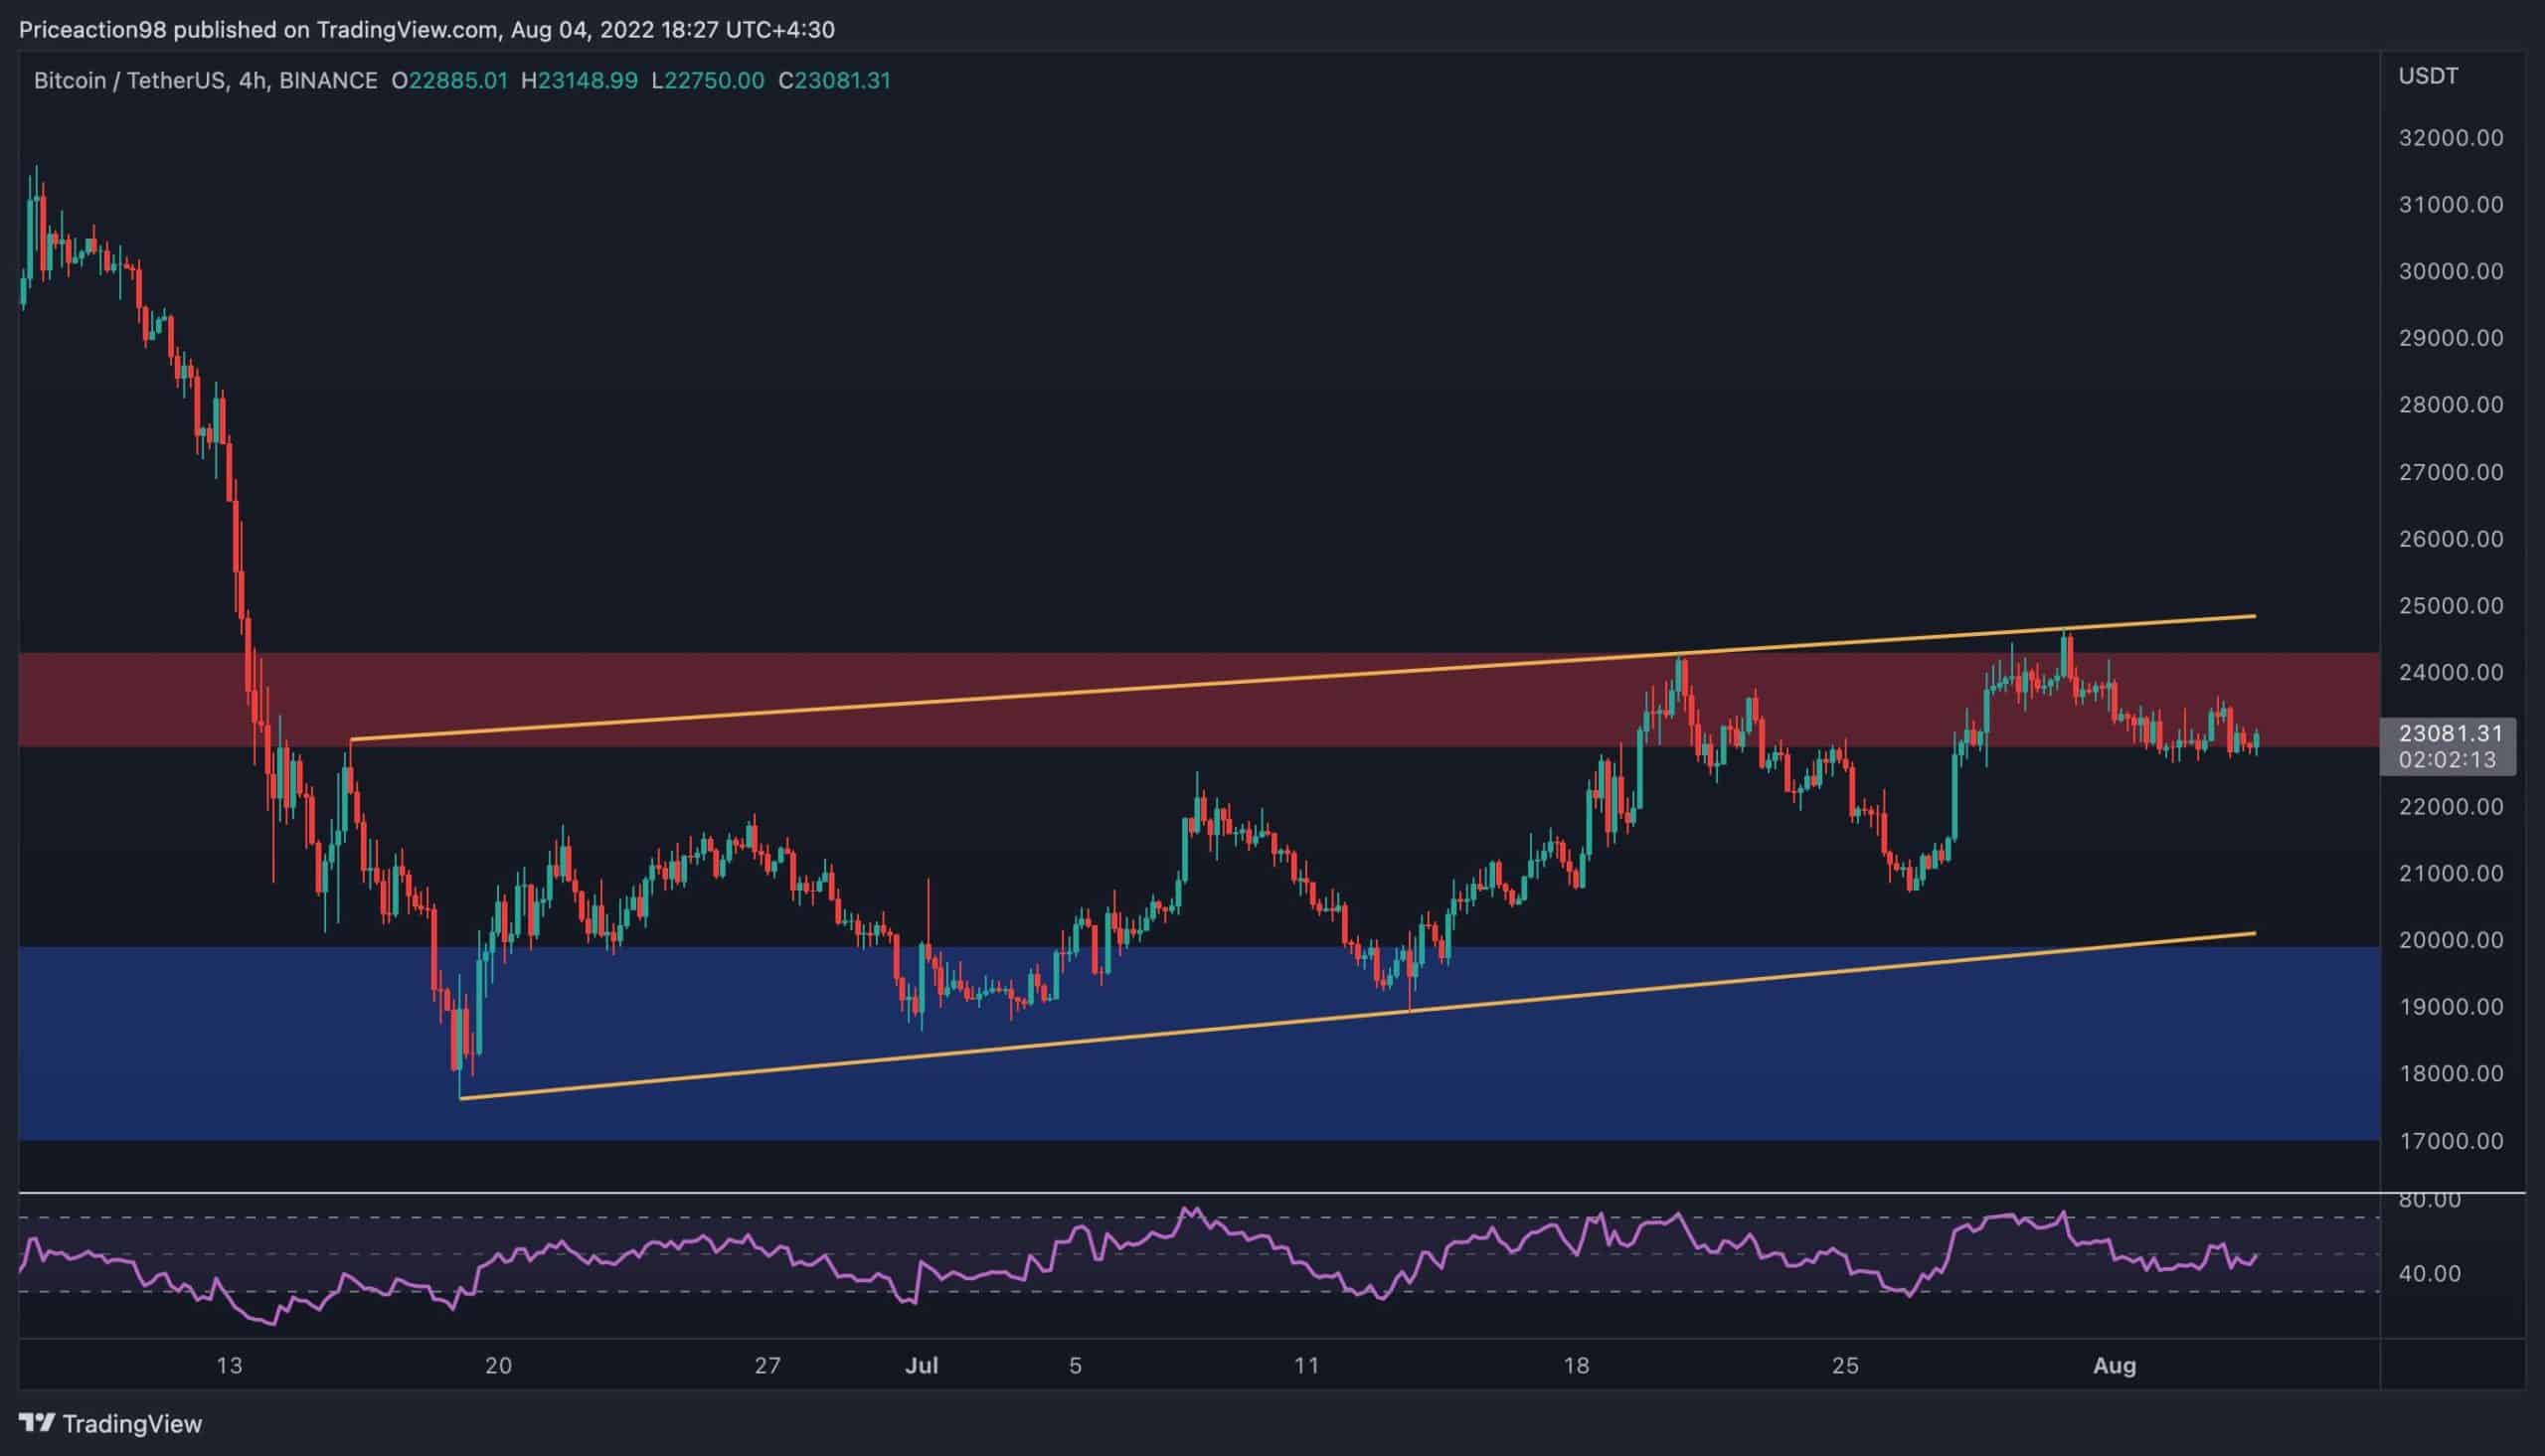
The 4-Hour Chart
On the 4-hour timeframe, the price is still trapped inside the bearish flag pattern after testing the higher trendline for the third time and being rejected once again. The bearish flag is a continuation pattern, and if the price fails to break above it, another drop towards the $17K level and beyond would be likely. The market is currently experiencing chopping price action as the weekend approaches, and a clear direction cannot be identified.
The RSI – a useful indicator in determining the dominance of bullish or bearish momentum – is also oscillating around the 50% mark, pointing to the current uncertainty in price action. The next few days will be key, as the next big move would likely shape around these prices.