A closely followed analyst is highlighting one key historical metric as an indicator that Bitcoin (BTC) may finally have set a bottom after an eight-month-long bear market.
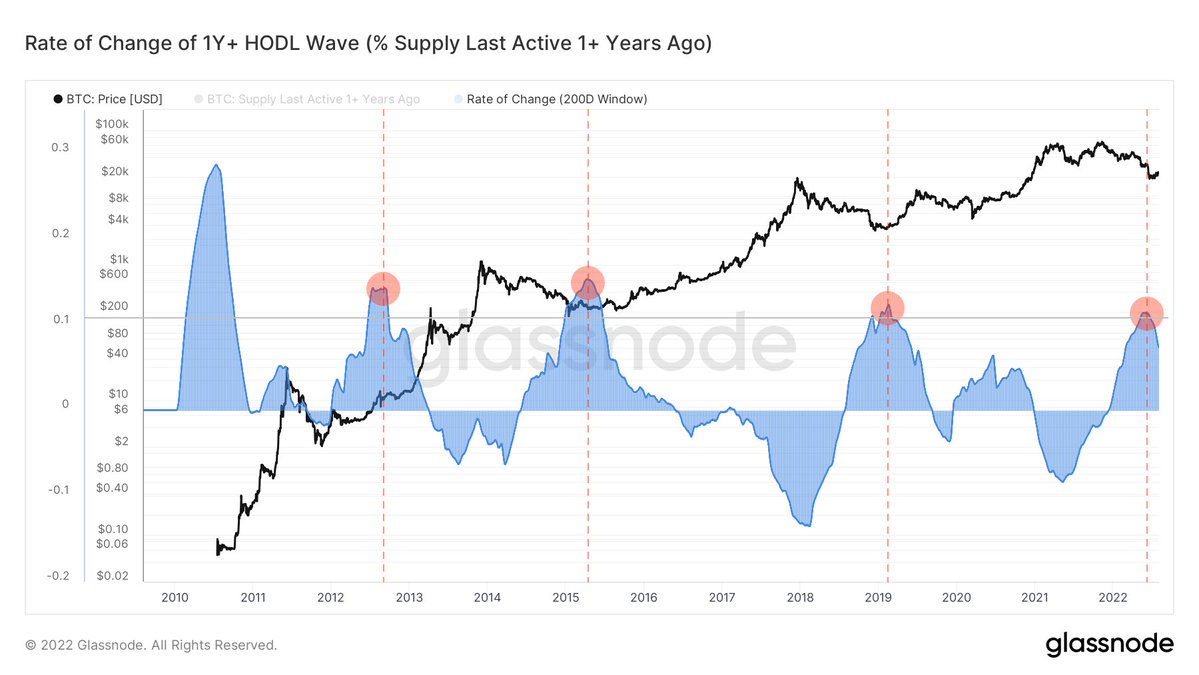
The pseudonymous crypto enthusiast TechDev tells his 399,600 Twitter followers about the significance of 1-year HODL waves, a metric that keeps track of Bitcoin that has remained dormant for over a year. During three prior instances where static BTC peaked in 2012, 2015 and 2019, a rally soon followed.
“1 yr+ HODL wave 200-day rate of change peaks over 0.1.
4 signals in 11 years.”
At time of writing, Bitcoin is down less than a percent in the past 24 hours and trading for $23,066.
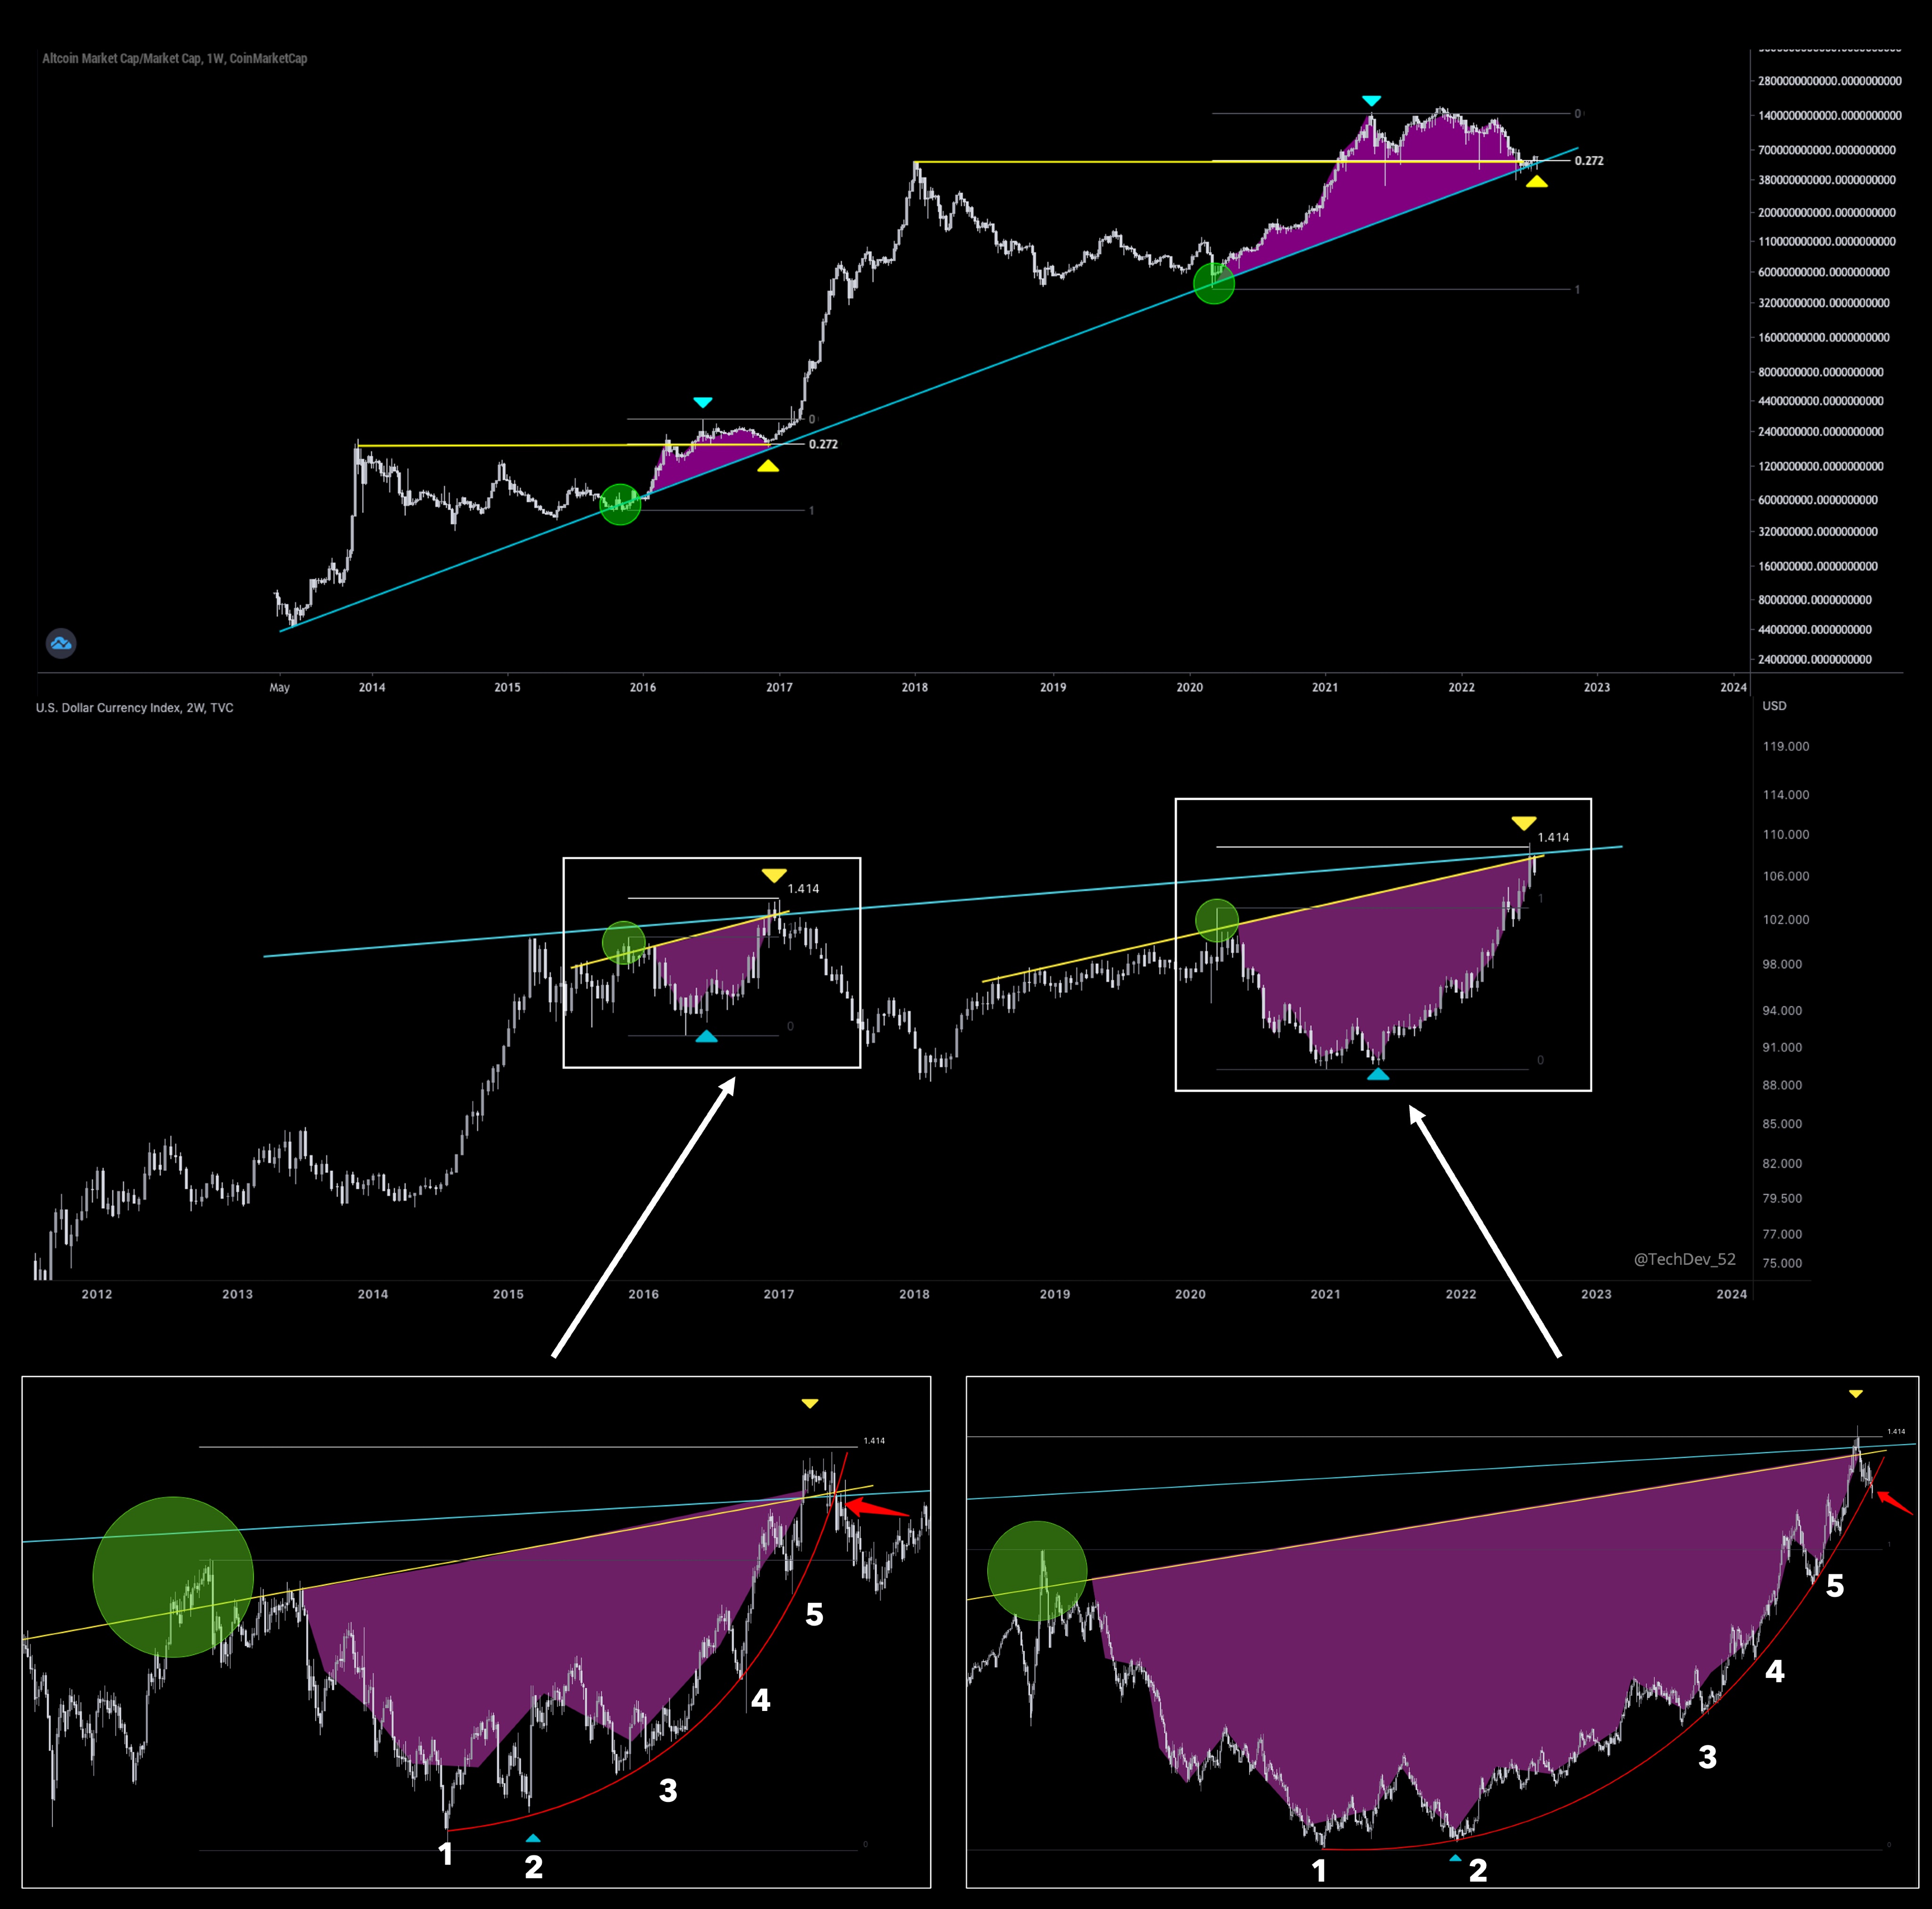
TechDev next looks at how altcoins have performed against the US dollar index (DXY) over nearly a decade while plotting out Fibonacci extensions that suggest altcoins might be primed to move higher if the DXY falters.
“Altcoins bouncing from long-term TL [timeline] + prior ATH [all-time high] + 0.272.
DXY at long-term TL + local TL + 1.414 after parabolic move.
Possible parabola breakdown after 5 touchpoints and 1.414 extension into 2 TLs.
Watching for further confirmation of DXY breakdown and altcoin impulse.”
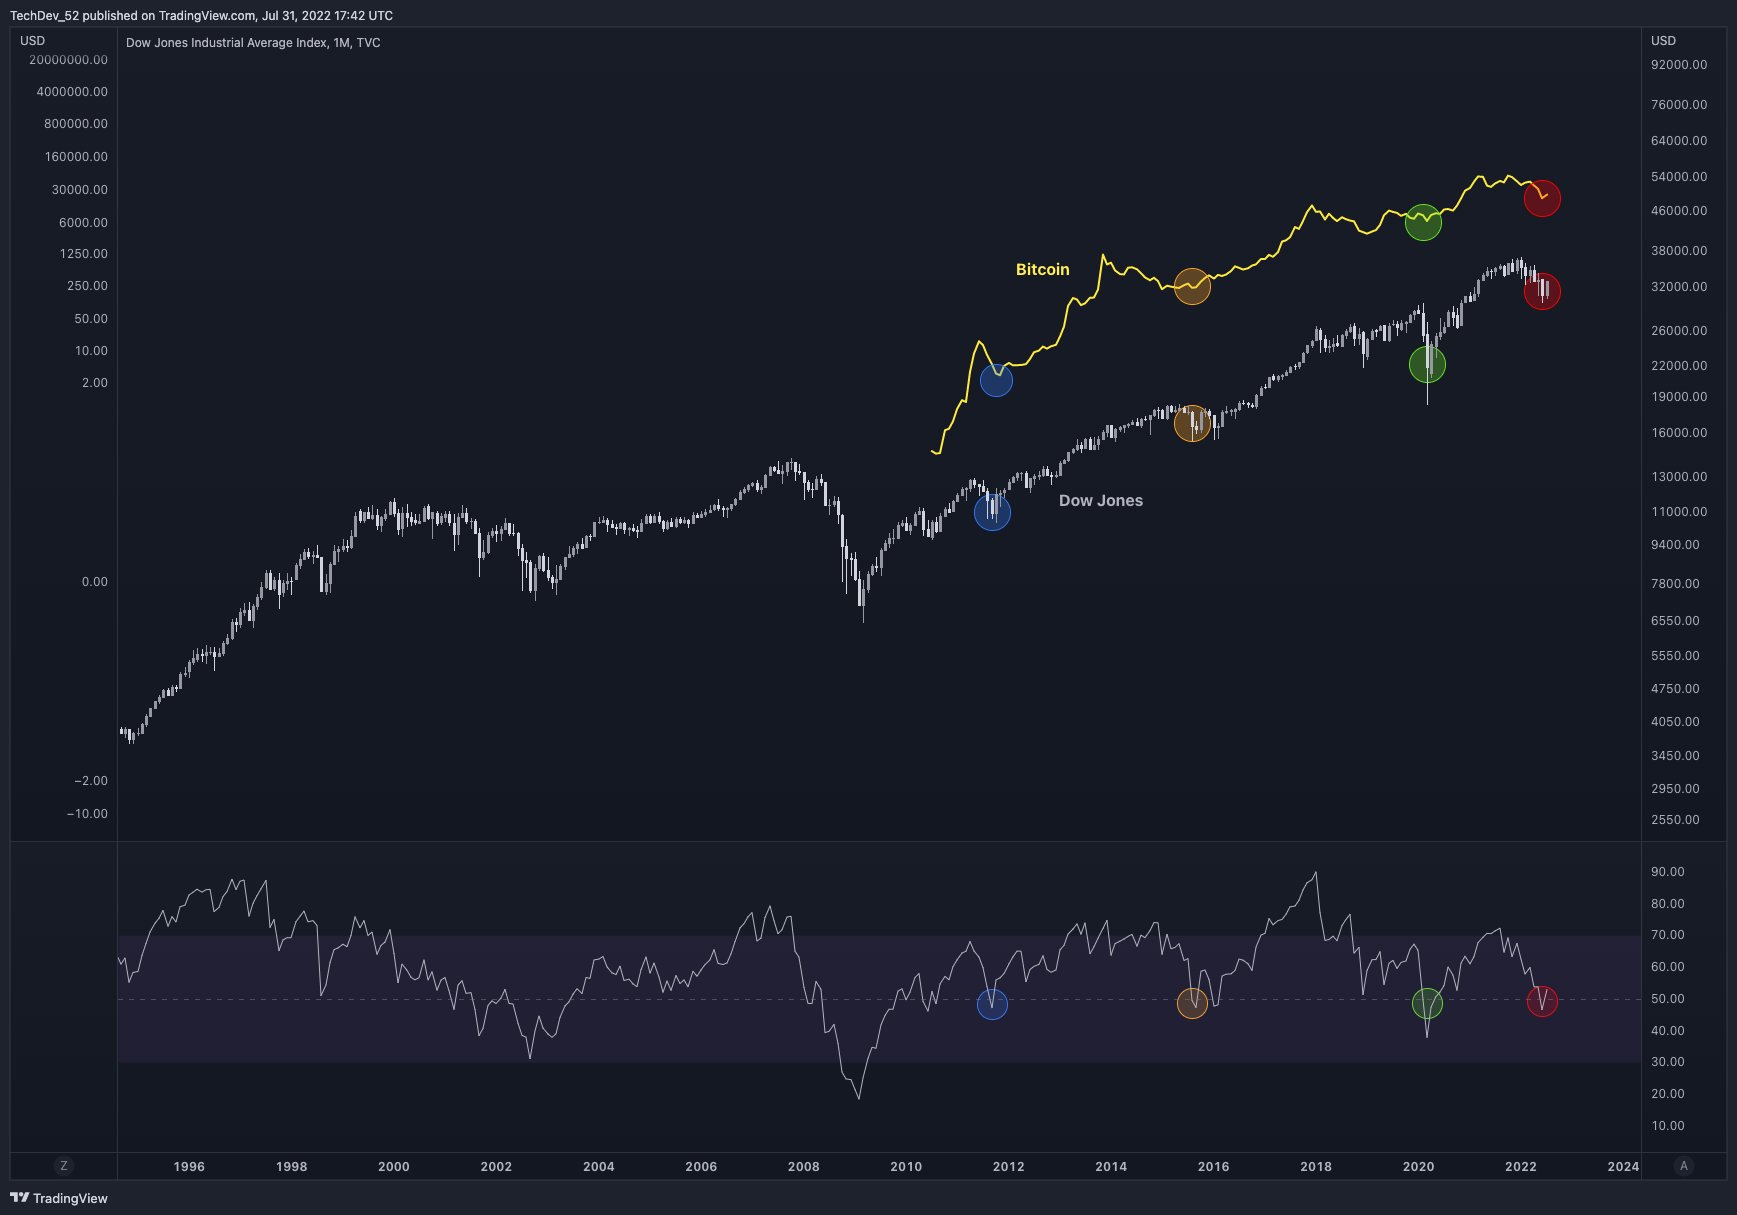
The analyst wraps up by comparing Bitcoin’s relative strength against the top 50 Dow Jones stocks dating back to 2012. The relative strength index (RSI) is an indicator used by traders to gauge the momentum of an asset’s trend, where a falling RSI suggests strong bearish momentum and vice versa.
TechDev provides a chart that shows similar up-and-down price momentum while highlighting key moments in 2012, 2016, 2020 and this year.
“Bitcoin and Dow Jones 50 monthly RSI interactions.”