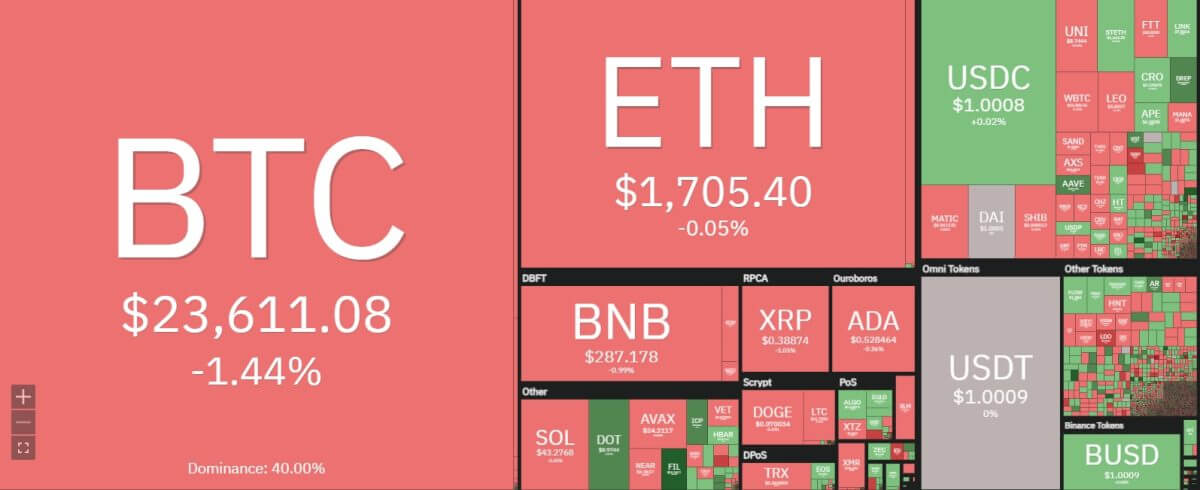
Bitcoin price analysis shows that the pair is undergoing sideways movement during the weekend. The crypto industry is also coming out of the prolonged winter and has recovered slightly from June lows. However, the current rally has not yet fully matured into a long-term uptrend. The BTC/USD pair has risen about 35 percent from the mid-June lows.
 Source: Coin360
The major cryptocurrency is showing signs of another bearish flag on the hourly charts but the pair is still holding onto $23,800 level. The consolidation is sure to help the bulls as they enter the new week with more volumes and momentum. The lower boundary of the triangle pattern is supporting the price towards $24,000. It remains to be seen whether the solid support acts as a base for the next week’s rally.
Bitcoin price movement in the last 24 hours: Is mini rally over or another bullish leg is pending?
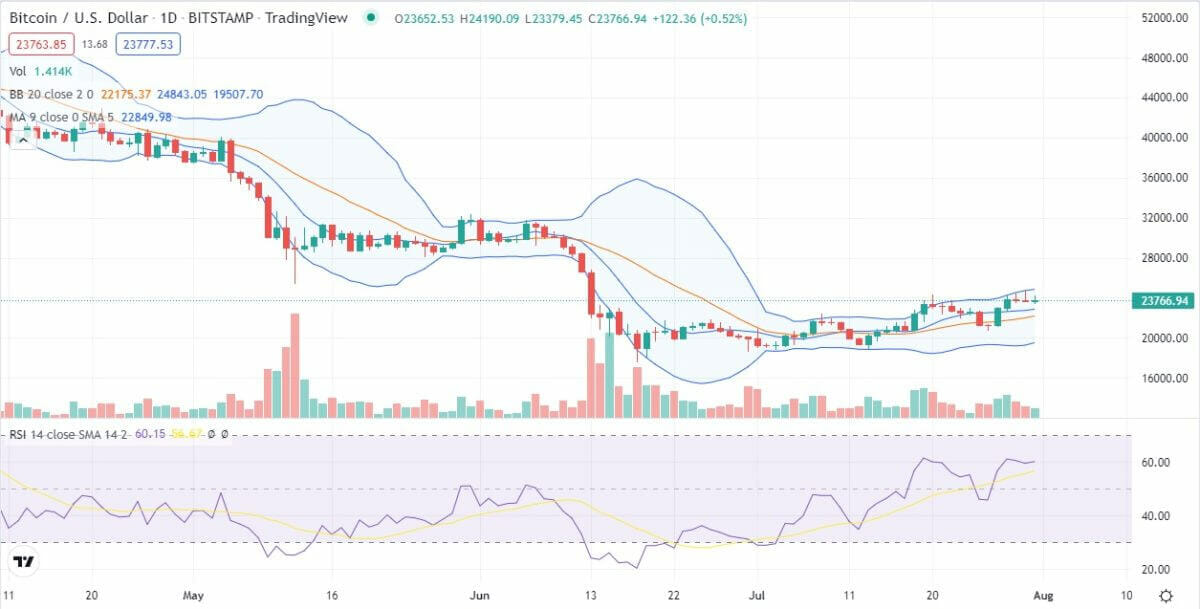
The triangular pattern is now turning bullish with the rising price channel. The 50-day moving average at $21,300 is now comfortably below the price. Chances of a pullback are slim and the pair is undergoing consolidation at the current levels. Next target is surely the $27,000 price level where the 100-day moving average awaits the bulls with considerable resistance as per Bitcoin price analysis.
 Source: TradingView
Bitcoin price analysis shows that the price is headed towards $27,000 level and another bullish leg is certainly on the cards. The upper trendline is sure to offer major resistance as large-scale short positions will be liquidated. Bears will try to push down the prices below the 50-day moving average at $21,000. Such a move will result in capitulation and end the current minor bullish rally.
BTC/USD 4-hour chart: Wedge pattern supports bullish move
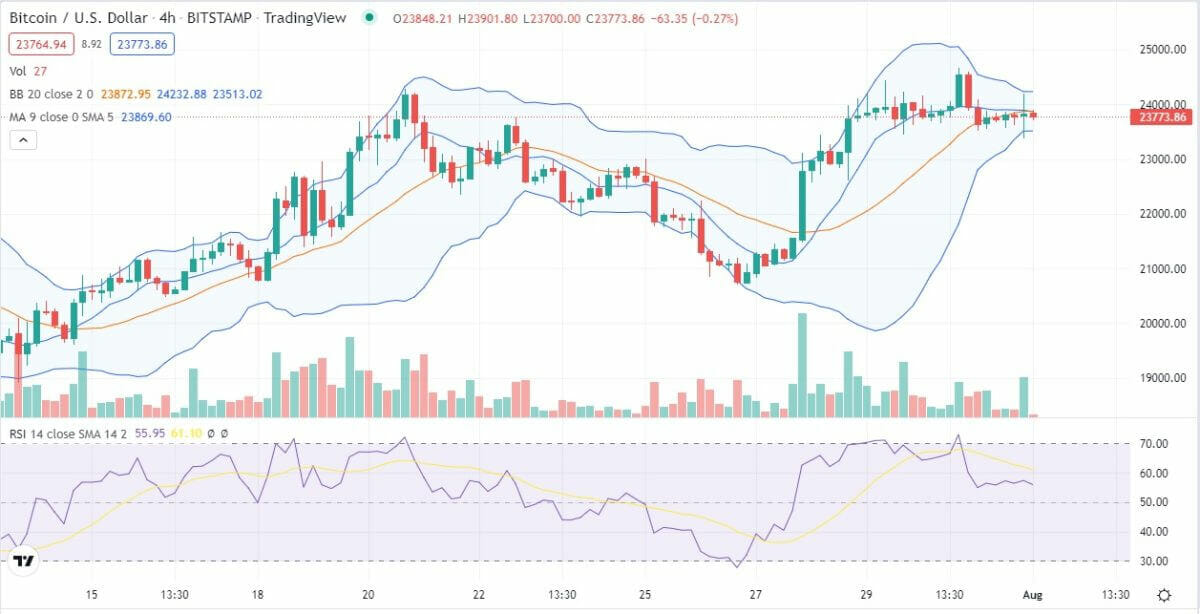
Bitcoin price analysis on the hourly charts is showing slowdown in the price action. The wedge pattern can result in the price moving towards $19,000 level. Any significant breakout from the wedge will result in the bullish rally. The upside will be the swing high of the current triangle pattern where the $27,500 resistance will be breached.
 Source: TradingView
A threat to the bullish rally would be the emerging double-top pattern on the hourly charts as per Bitcoin price analysis. To prevent such a mishappening, bulls need to ensure that $23,900 level is maintained till the close of the day. The bearish divergent pattern on the technical indicators, including RSI, is also showing signs of a slowdown in the buying momentum.
Bitcoin price analysis conclusion: Next week holds the key to current bull rally
There is ample support for Bitcoin at $20,000 level where the bulls will increase buying action. If the price falls to $21,000 level, the divergent bearish indicators will swing into action and sellers will take the price towards $20,000 support zone real quick. In extreme selling case, the bears will take the BTC/USD pair towards $18,000.
Profit booking may result in further downturn on the hourly charts. The current accumulation phase is not yet fully supported by large volumes and is therefore subject to correction. The market saw capitulation near $20,000 level and the same may be witnesses again if the prices fall drastically.
Disclaimer. The information provided is not trading advice. Cryptopolitan.com holds no liability for any investments made based on the information provided on this page. We strongly recommend independent research and/or consultation with a qualified professional before making any investment decisions.