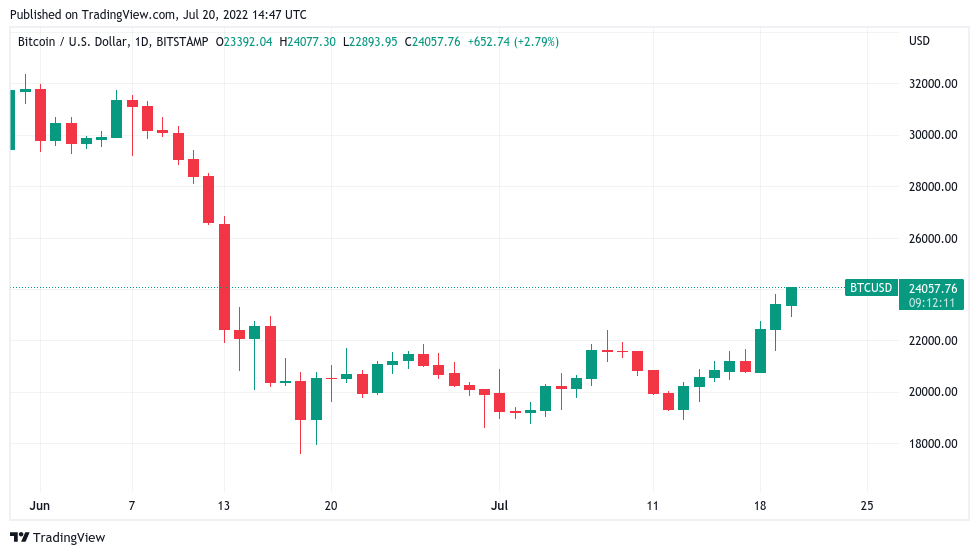
Bitcoin (BTC) touched $24,000 at the July 20 Wall Street open as the good times kept rolling for crypto markets.
BTC price rally "all macro driven"
Data from Cointelegraph Markets Pro and TradingView showed BTC/USD passing its latest milestone after brief consolidation.
24-hour gains for the pair remained at nearly 8% and weekly returns near 25% as Bitcoin and altcoins benefitted from a declining U.S. dollar and rising stock markets.
Bitcoin's rise had seen bulls reclaim key trendlines lost in June, but the jury remained out on whether the newfound strength could endure beyond the current weekly candle.
"Bitcoin rally looking good? Yes. But BTC shall take no pride in this rally," analyst Venturefounder commented.
"BTC and NASDAQ correlation is still at 91% (historical high), and both of which are looking at the Fed policies, interest rate & recession concern forecast and $DXY for guidance. All is macro driven."
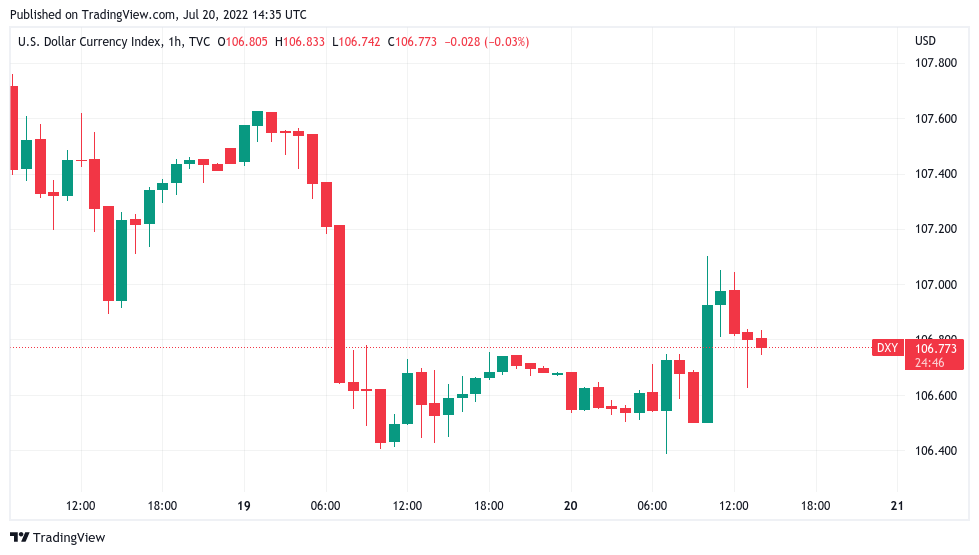
The U.S. dollar index (DXY) nonetheless showed no signs of staging its own successful recovery on the day, getting rejected at 107 after a local bottom.
Popular trader and analyst Josh Rager meanwhile demanded a "confident" tip to the $30,000 zone in order for Bitcoin to truly flip from bearish to bullish.
Two weeks ago mentioned $BTC looked good for $28k with a breakout
— Rager (@Rager) July 19, 2022
Slowly but surely, would love to see this push up anoher 20%+ in order to take profits https://t.co/Mzl7wF76y2
Metric predicts up to $120,000 in 2023
Zooming out, one Bitcoin price indicator led analyst TechDev to believe that BTC/USD would see a new all-time high before its next block subsidy halving in 2024.
Related: 100X Bitcoin energy use would mean ‘absurd’ $20M BTC price — developer
TechDev flagged the True Strength Index (TSI) for Bitcoin, a metric which uses several base calculations to determine how overbought or oversold the asset is at a particular price.
The price decline since the last all-time high in November 2021 remains on-trend, he argued, and thus the potential for historical patterns to repeat themselves.
As such, I expect:
— TechDev (@TechDev_52) July 20, 2022
- Intermediate wave 5 top at 80-120K in 2023
- Primary wave 4 down to 30-50K in 2024
- Primary wave 5 over 200K in 2025 to conclude cycle wave 3
Detailed chart with supporting evidence is forthcoming.
I'm sure now that it's written down it won't happen.
4/4 pic.twitter.com/iRx5PUSGSU
A recovery underway in Bitcoin's relative strength index (RSI) additionally caught the attention of Stock-to-Flow model creator PlanB.
The views and opinions expressed here are solely those of the author and do not necessarily reflect the views of Cointelegraph.com. Every investment and trading move involves risk, you should conduct your own research when making a decision.