- The team at Bakkt has released more information regarding their upcoming launch.
- The team is also hiring at this moment in time.
- Support moving forward: $3,508, $3,467, $3,421, $3,350, $3,300, $3,228.
- Resistance moving forward: $3,569, $3,664, $3,851, $3,896, $3,942, $4,001
Latest Bitcoin News
Over the past week, more details have been revealed regarding the upcoming Bakkt exchange. The exchange was scheduled to be launched in December 2018 but has since been delayed to sometime in “early 2019.”
It appears that the Bakkt exchange, an exchange that will provide physically-backed futures contracts for Bitcoin, still requires approval from the U.S. Commodities and Futures Trading Commission before the exchange can launch.
The team has also recently started another hiring process as they continue to expand their team. They are looking for software developers, institutional sales managers and security engineers.
Let us continue to take a look at price action for Bitcoin over the recent period and highlight some potential areas of support and resistance moving forward.
BTC Price Analysis
Over the past 24 hours, Bitcoin has seen a small price increase totaling 1.10%, bringing the current trading price up to $3551, at the time of writing. The cryptocurrency king has now seen a 2.32% price decline over the past 7 trading days, with a further 7.84% price fall over the past 30 trading days.
Bitcoin currently holds a $61.24 billion, up $90 million since our last analysis, but is down by a significant 45% over the past 90 trading days.
What Has Happened Since Our Last Analysis?
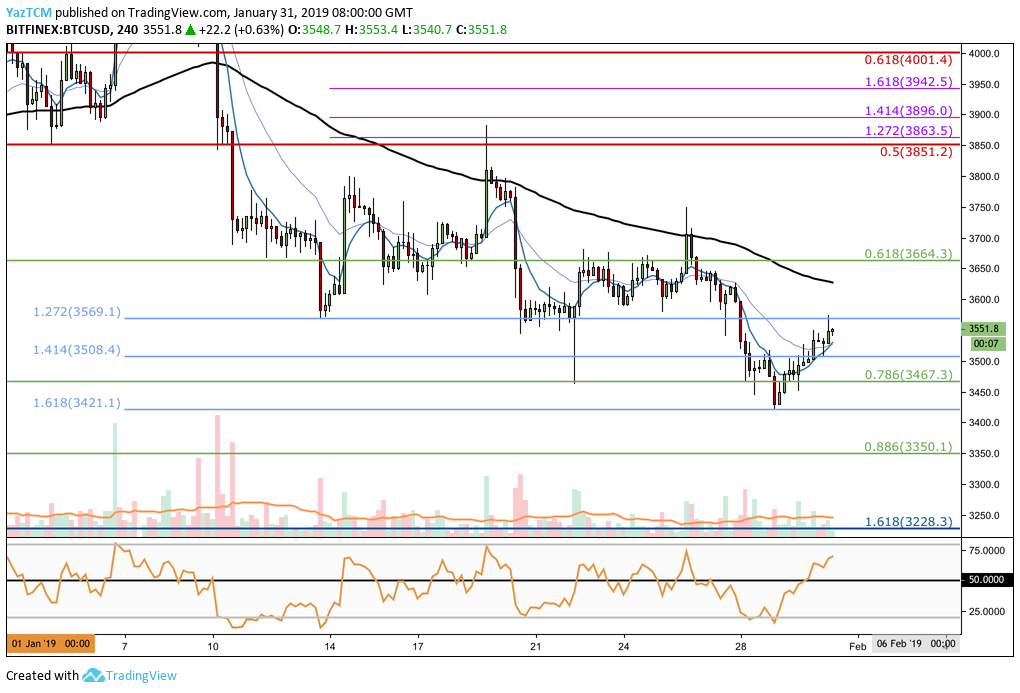
Taking a look at BTC/USD from the 4HR perspective above, we can see that since our last analysis for BTC, price action has broken below our previously highlighted support level at the short-term downside 1.414 Fibonacci Extension level (drawn in blue) priced at $3,508.
The market continued to fall further and broke below more support at the short-term .786 Fibonacci Retracement level (drawn in green) priced at $3,467. Price action continued to head downwards until it reached further support at the short-term downside 1.618 Fibonacci Extension level (drawn in blue) priced at $3,421.
As the market hit this area of support, price action reversed and began to head higher once again. BTC/USD is now trading just below resistance provided by the short-term downside 1.272 Fibonacci Extension level (drawn in blue) priced at $3,569.
Trend: Bearish
The long-term trend for BTC/USD is still bearish. If price action breaks above the $3,570 handle, then the market condition will turn into a neutral one.
For this market to be considered bullish, we would need to see price action rise and break cleanly above the $3,700 handle.
Where is Bitcoin Likely to Head Towards Next?
If the short-term bullish momentum can persist within the market and push BTC/USD above the resistance at the short-term downside 1.272 Fibonacci Extension level (drawn in blue) priced at $3,569, we can expect higher resistance at the short-term .618 Fibonacci Retracement level (drawn in green) priced at $3,664.
If the buying pressure continues to push price action higher and causes BTC/USD to penetrate above $3,800, there is further resistance at the bearish .5 Fibonacci Retracement level (drawn in red) priced at $3,851. This Fibonacci Retracement level is measured from the high of $4,488, seen on November 29, 2018 to the low seen during December 2018.
More resistance above $3,851 can then be expected at the short-term 1.414 and 1.618 Fibonacci Extension levels (drawn in purple) priced at $3,896 and $3,942, respectively. This is then followed up with more resistance at the bearish .618 Fibonacci Retracement level (drawn in red) priced at $4,001.
What if the Sellers Continue to Push BTC Price Action Lower?
Alternatively, if the sellers continue to pressure price action below the current support at the short-term downside 1.618 Fibonacci Extension level (drawn in blue) priced at $3,421, we can expect immediate support below at the short-term .886 Fibonacci Retracement level (drawn in green) priced at $3,350.
If the market heads even lower and breaks below the $3,300 handle, we can expect more support below at the previous long-term downside 1.618 Fibonacci Extension level (Drawn in dark blue) priced at $3,228.
This Fibonacci Extension level provided support for the market to reverse at in December 2018, and therefore is expected provide a strong level of support moving forward.
What are the Technical Indicators Showing?
The RSI on the 4HR chart has now broken above the 50 handle once again, which indicates that the bulls have retaken the control of the momentum within the market. So long as the RSI can remain above the 50 handle, we can expect this market to continue to climb higher and make gains.
However, on the daily chart, the RSI still remains below the 50 handle which indicates that the bears are still control of the momentum within the market in the long term.
Conclusion
The recent bounce at the support located at $3,421 shows some signs of promise for Bitcoin investors. If the market now continues to climb and breaks above the resistance at $3,569, we can expect BTC/USD to continue to climb higher.
However, if price action rolls over again and heads lower, we should hope that the $3,421 handle can continue to provide support for the market.