Key highlights:
- Bitcoin is down by a small 1.5% today after hitting resistance at $36,000
- The cryptocurrency remains trading inside a short-term rising price channel as it battles to remain above the lower boundary
- The cryptocurrency recently broke resistance at a descending trendline that dated back to the May highs
| Bitcoin price | $34,550 |
|---|---|
| Key BTC resistance levels | $34,600, $34,1780, $34,420, $33,000, $32,650 |
| Key BTC support levels | $34,600, $34,1780, $34,420, $33,000, $32,650 |
*Price at the time of publication
Bitcoin is down by a small 1.5% today as the coin is rejected by resistance at $36,000. Despite this short-term price drop, BTC still remains up by a total of around 15% from the $30K price low seen over the weekend.
Since rebounding from the weekend low, BTC formed an ascending price channel as it surged as high as $36,514 (bearish .618 Fib Retracement) yesterday. From there, it has rolled over and headed into the lower boundary of the price channel as the buyers attempt to defend the level.
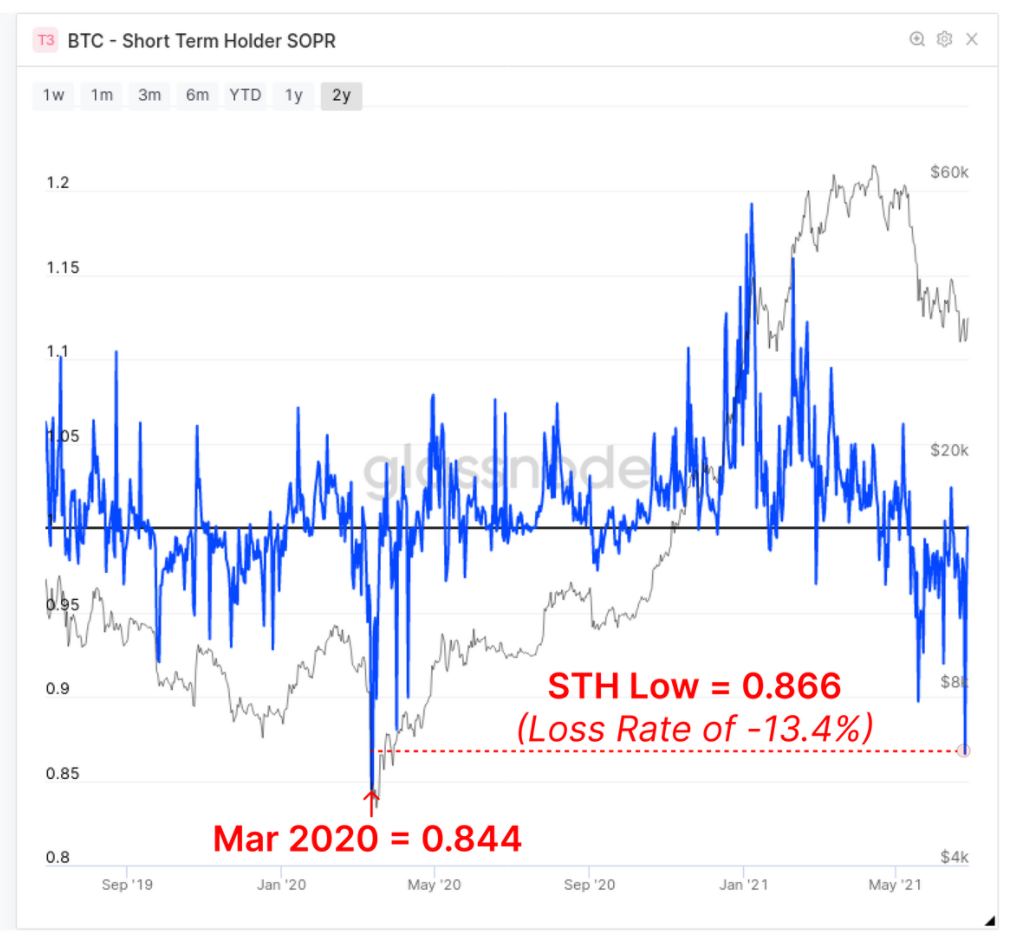
Looking at some metrics from Glassnode, it is apparent that many of the recent price drops are driven by short-term holders. The Short-term Holder SOPR is showing a ratio of 0.866, indicating that short term BTC traders are selling at an average loss rate of around 13%.
Looking at data from miners in the industry, the 7DMA Total Miner Revenue for all miners is currently down 65.5%.
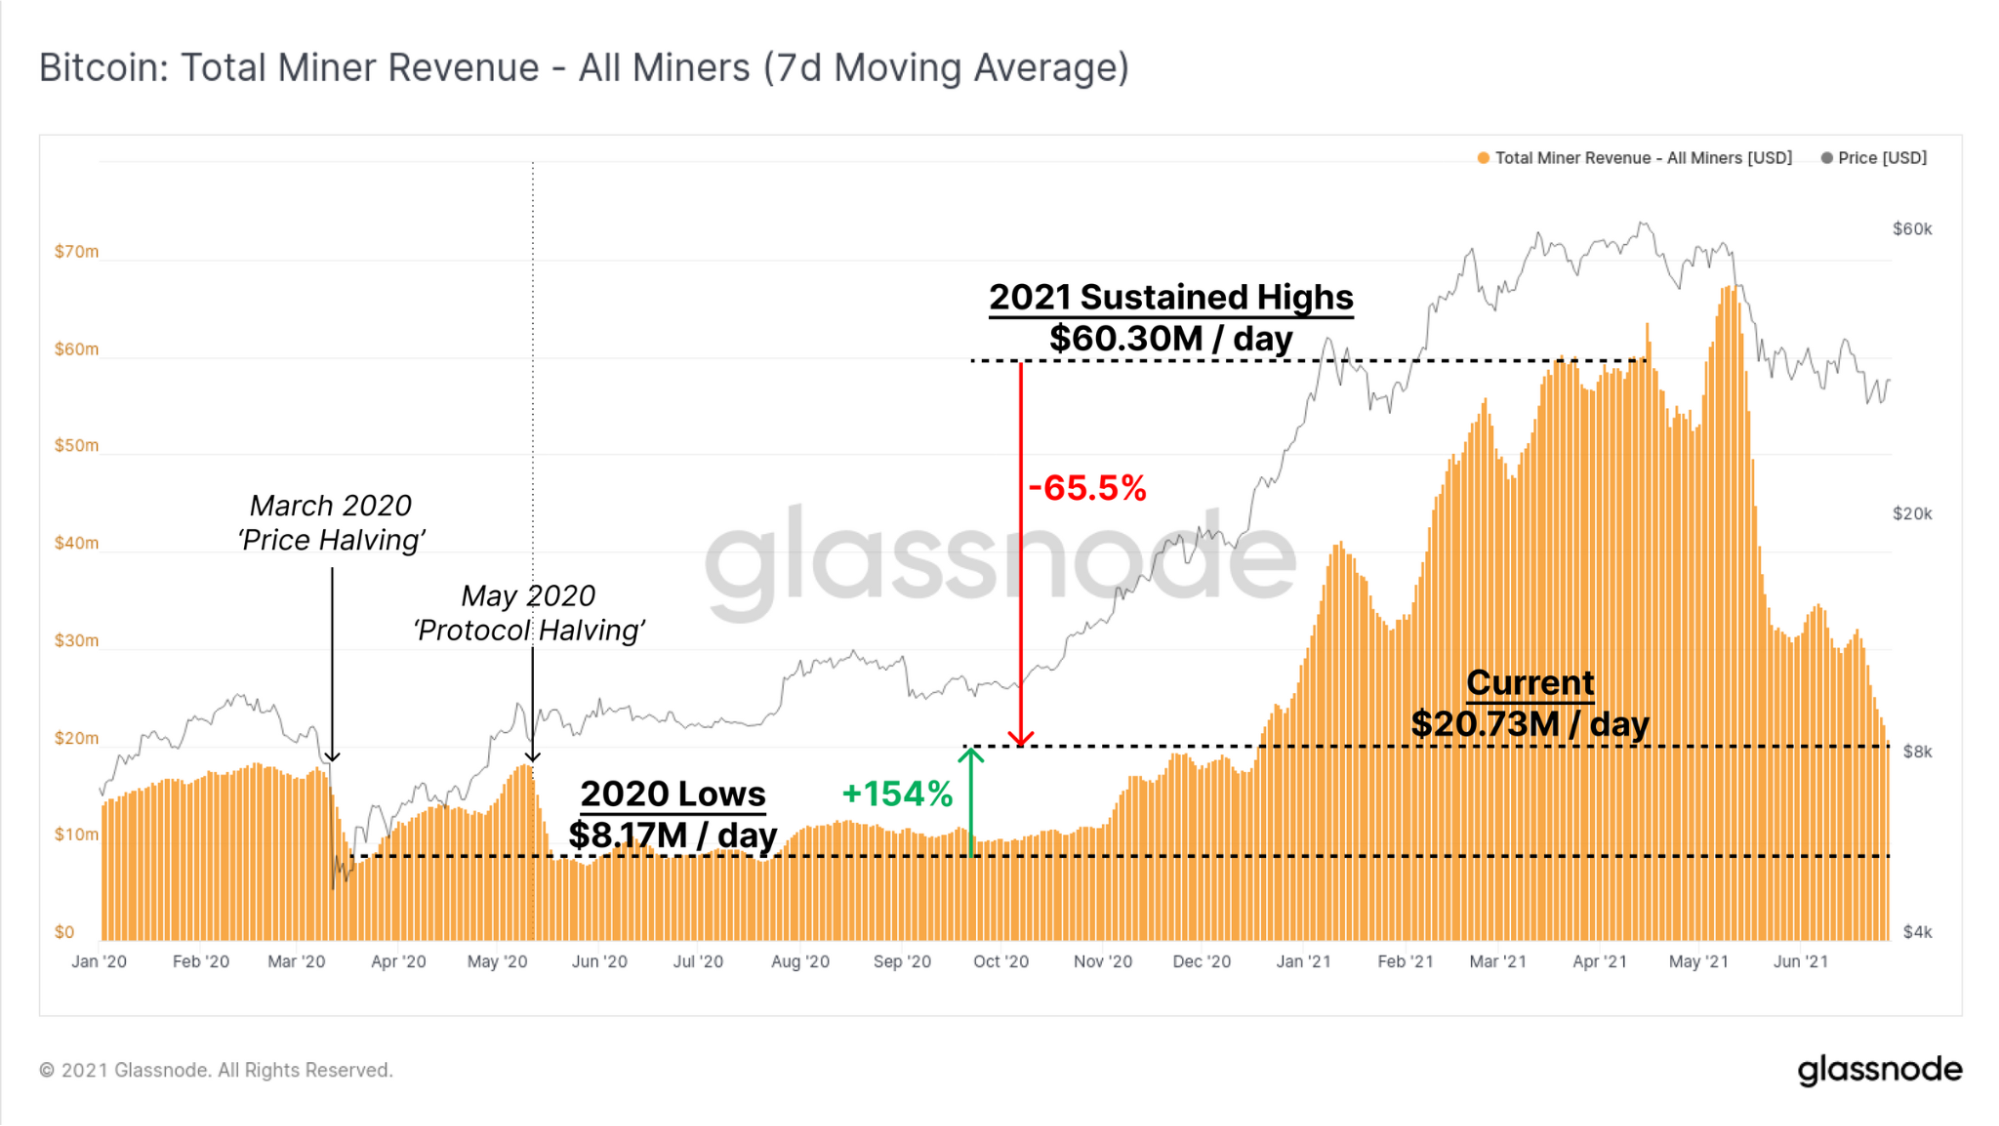
With miners earning less money for their same operational costs, analysts expect that there might be more selling pressure from miners in the coming weeks. Additionally, with the Chinese mining crackdown, many operations needed to relocate their business which incurs fees for transporting and setting up the facility again. With these additional fees, it should be expected that miners are likely to sell some more of their Bitcoin in order to cover their expenses.
If we take a look at the total Balance in Miner wallets, it seems that their balance is still up by over 10,000 BTC since January. This is a total of 7.6% of all BTC mined since then and suggests that there is no excessive selling from miners.
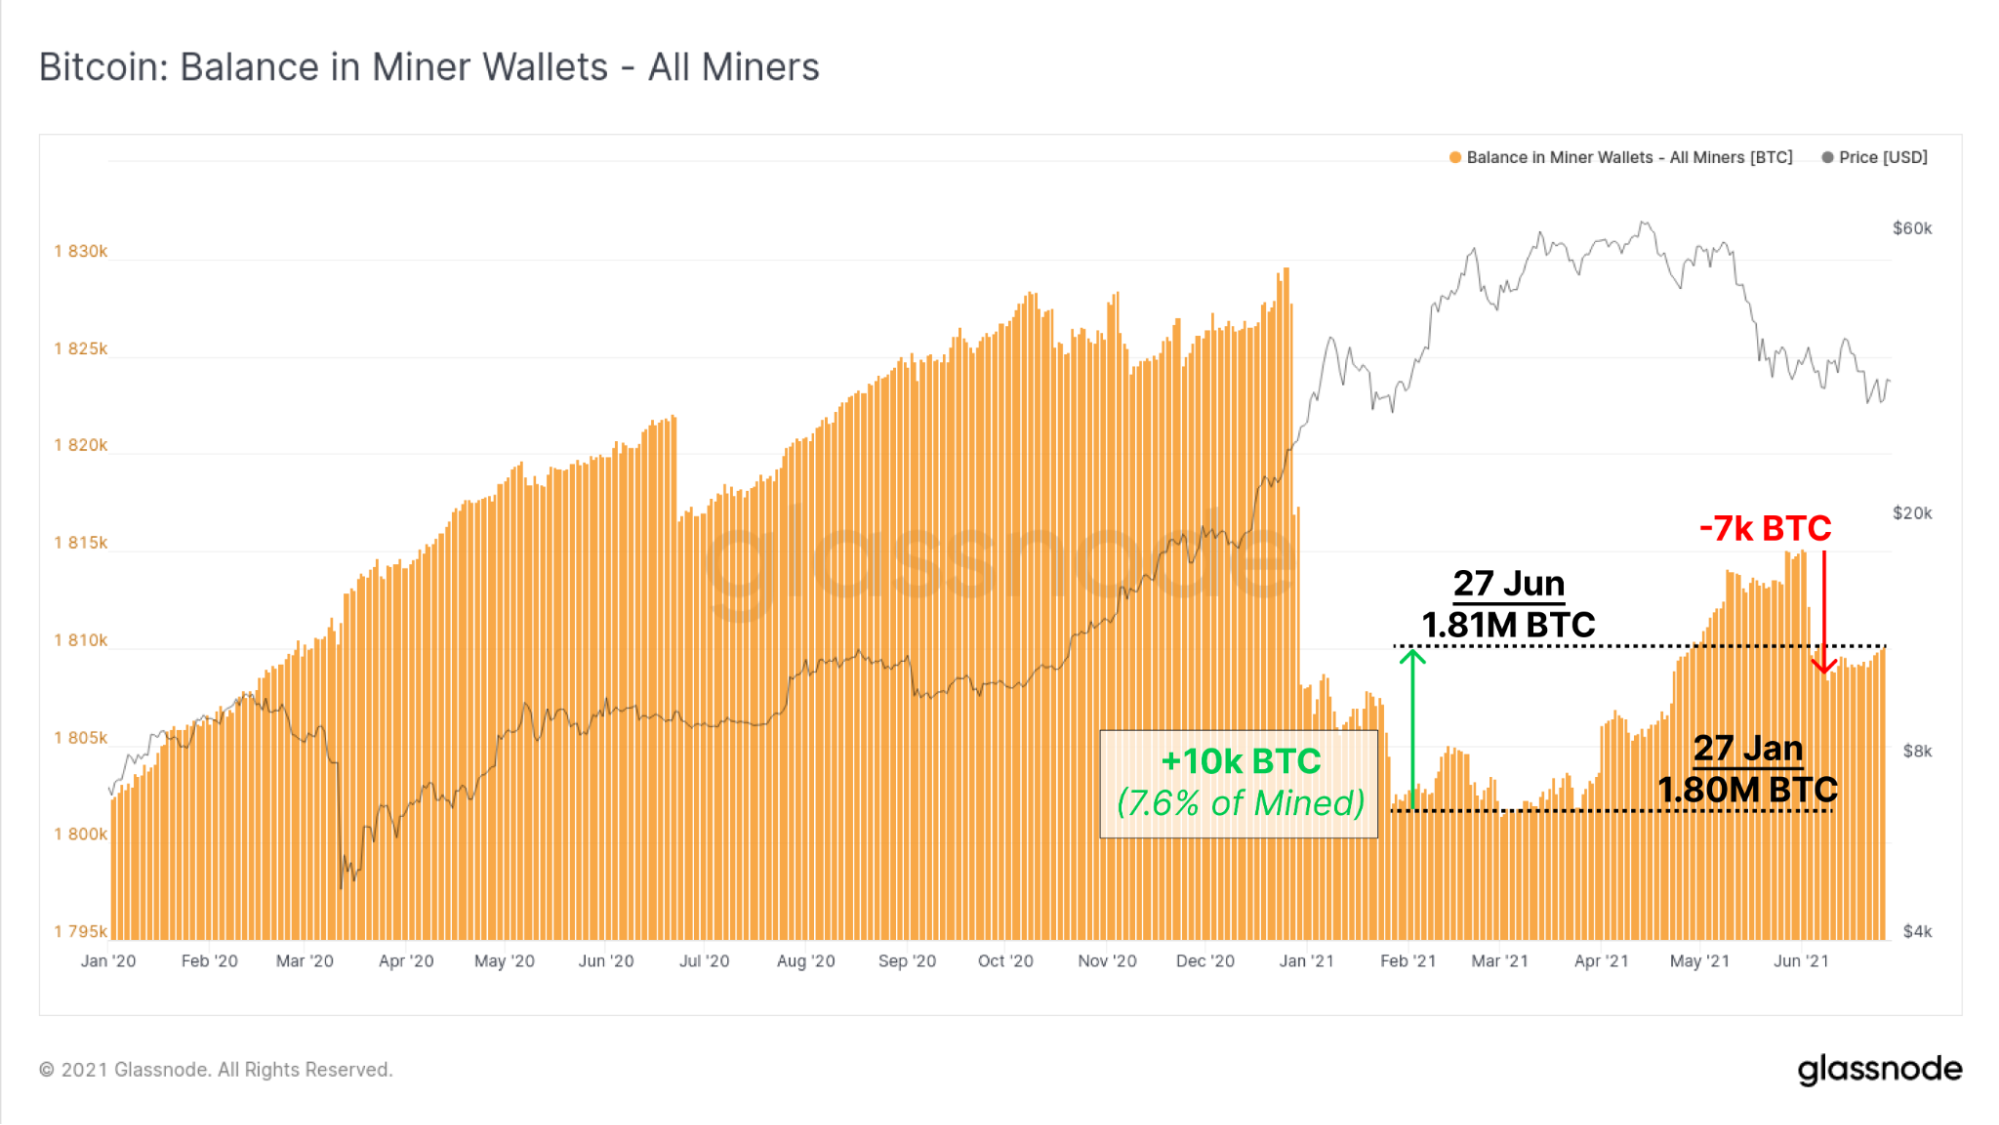
Interestingly, the chart shows that miners started to sell off the majority of their stash after we passed the previous ATH of $20K in late December.
On the institutional side of things, it seems that the demand from heavyweights remains quite slow. The discount available on the Grayscale GBTC trust has been trading at a persistent discount to the Bitcoin price since February 2021:
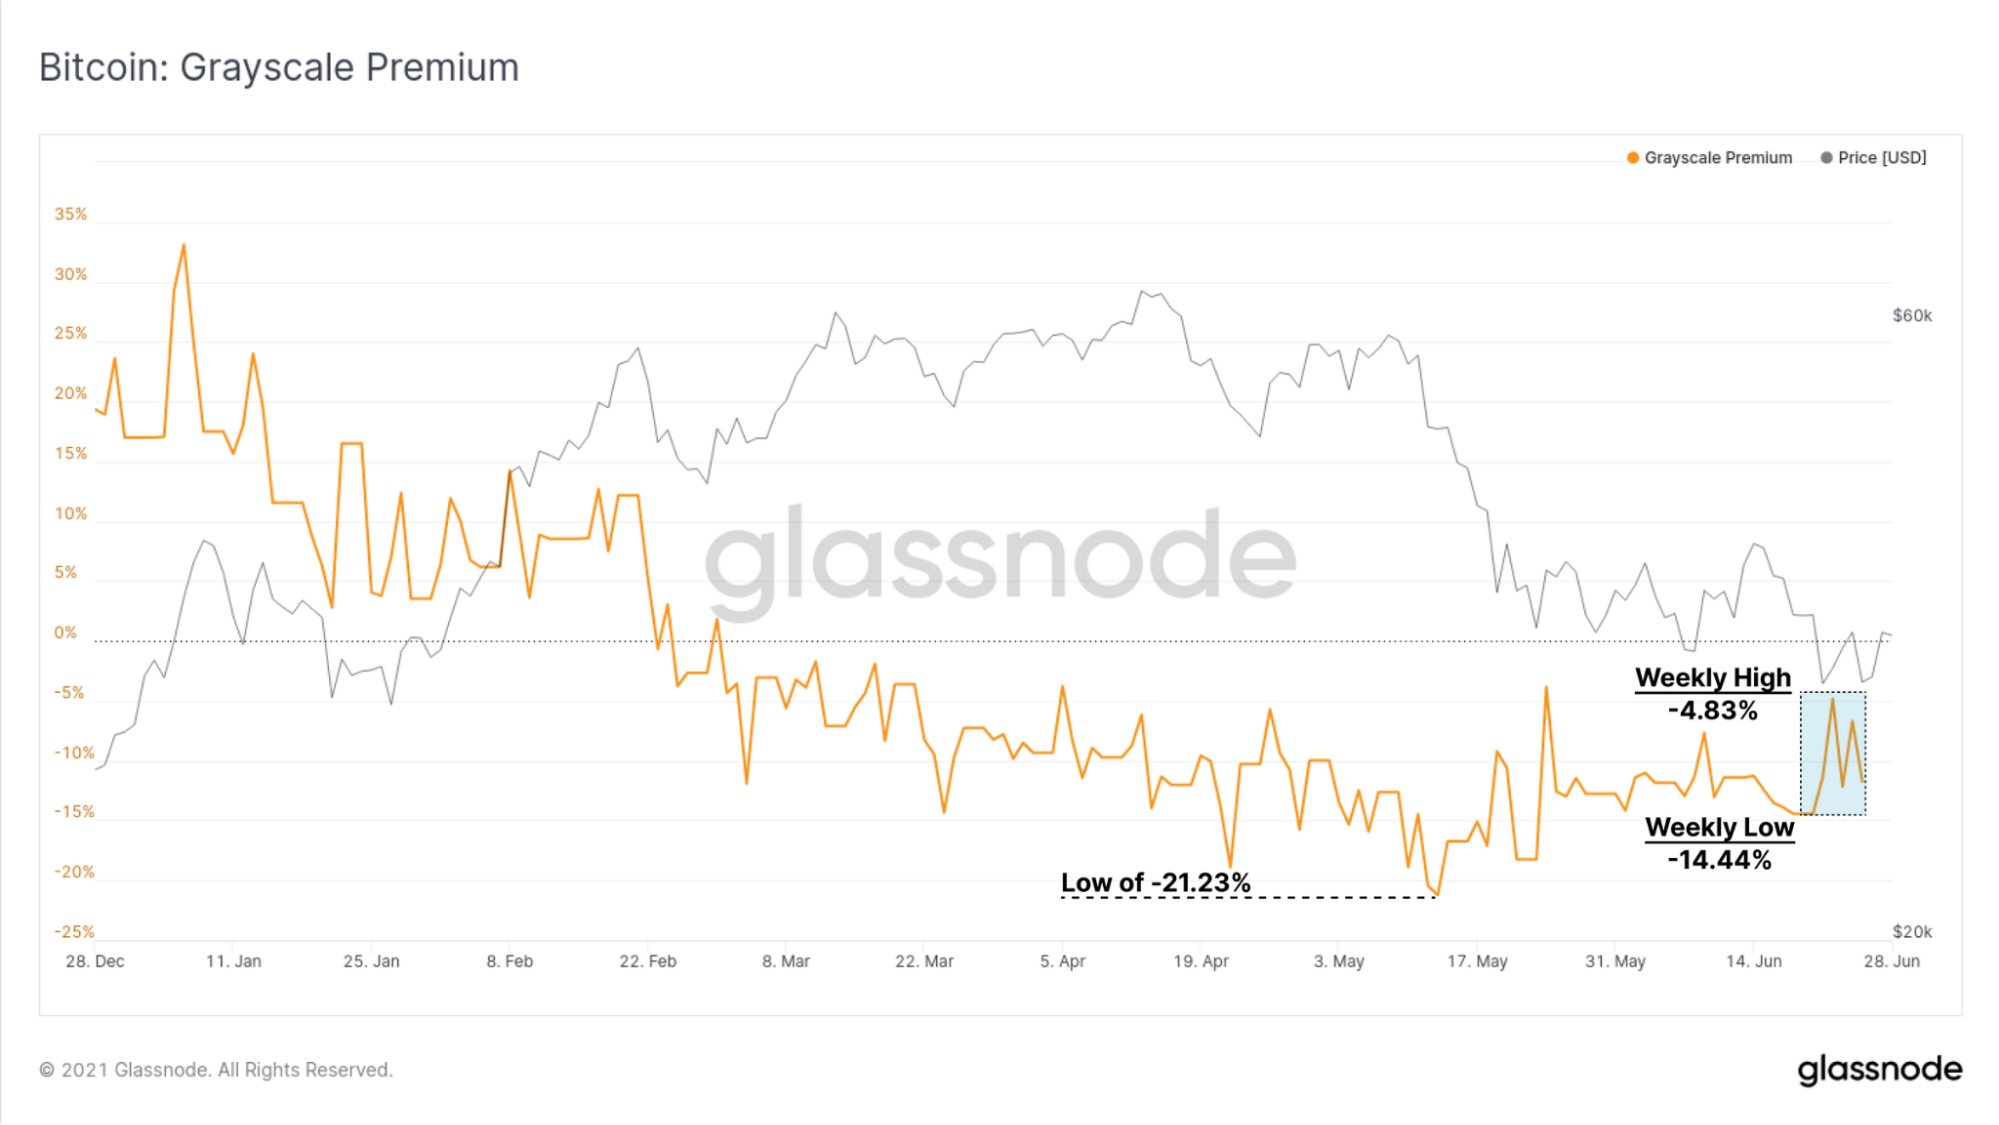
With the discount appearing, it suggests that the inflows into the GBTC trust have started to slow. Nevertheless, the chart above shows a strong reducing discount since the mid-May low when the discount was -21.23%.
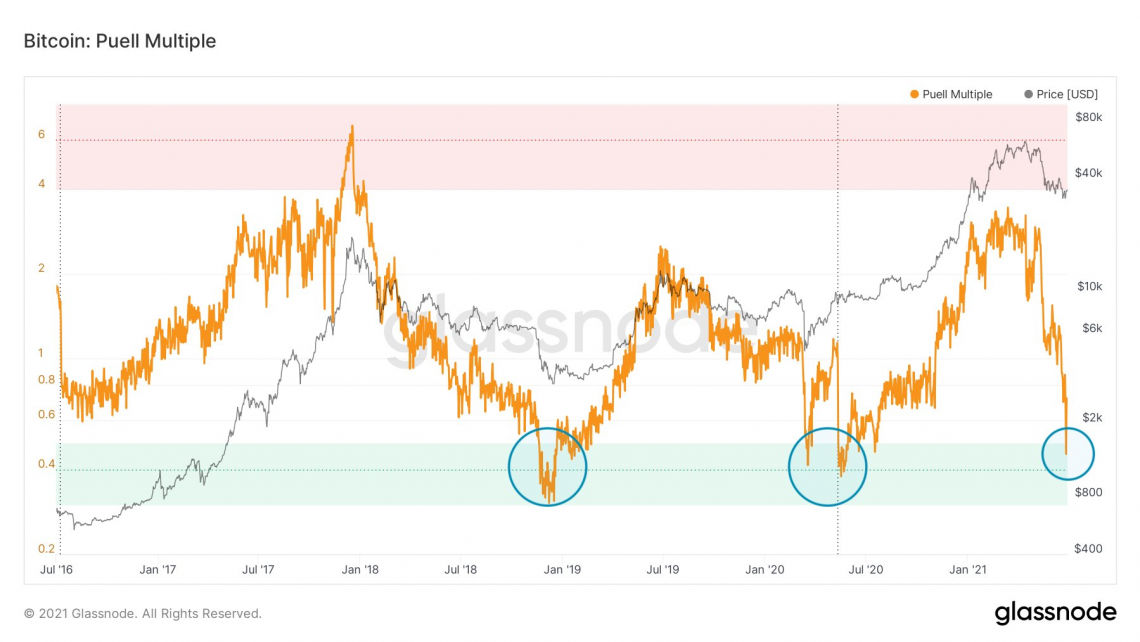
Lastly, a strong fundamental Bitcoin signal known as the Puell Multiple is in the green zone, suggesting that it might be a great time to buy BTC right now. The Puell Multiple dropping into the green zone is a bullish sign and, typically, each time the signal has been flagged a strong uptrend usually follows it in BTC price.
The recent price hike has allowed the market cap of BTC to surge back to $646 billion. Let us take a quick look at the markets and see where we might be heading.
Bitcoin price analysis
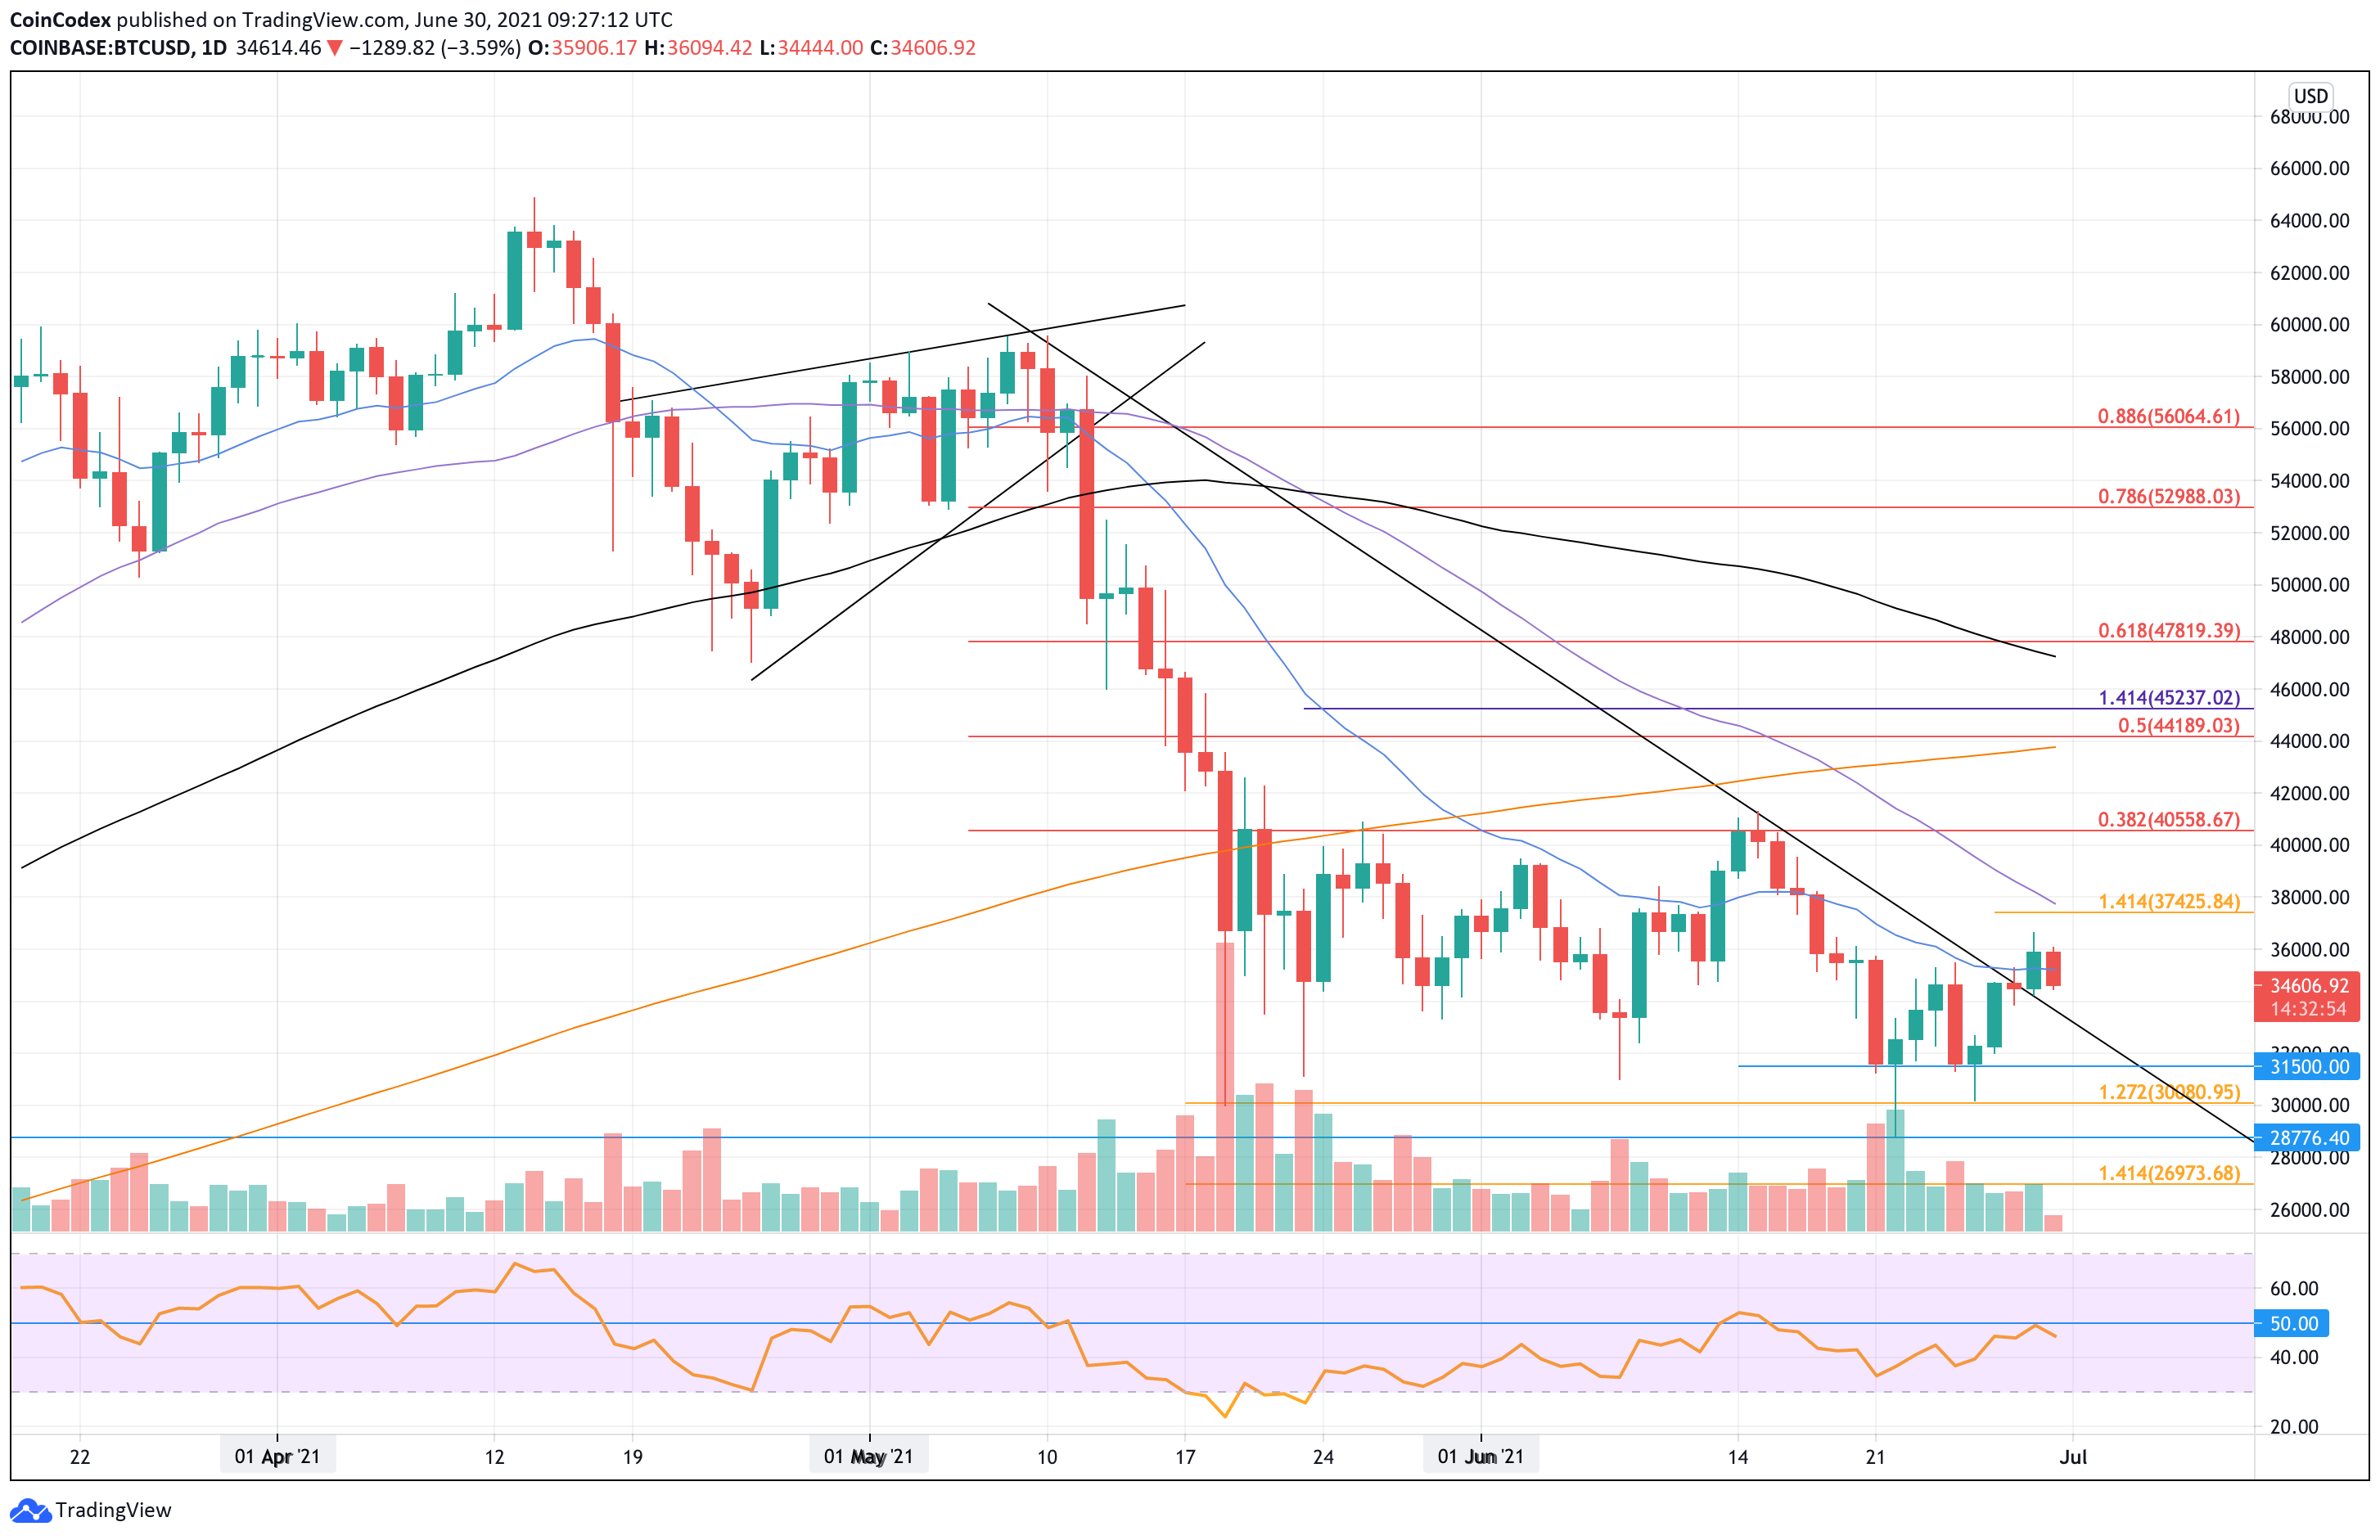
Daily chart
4-hour chart
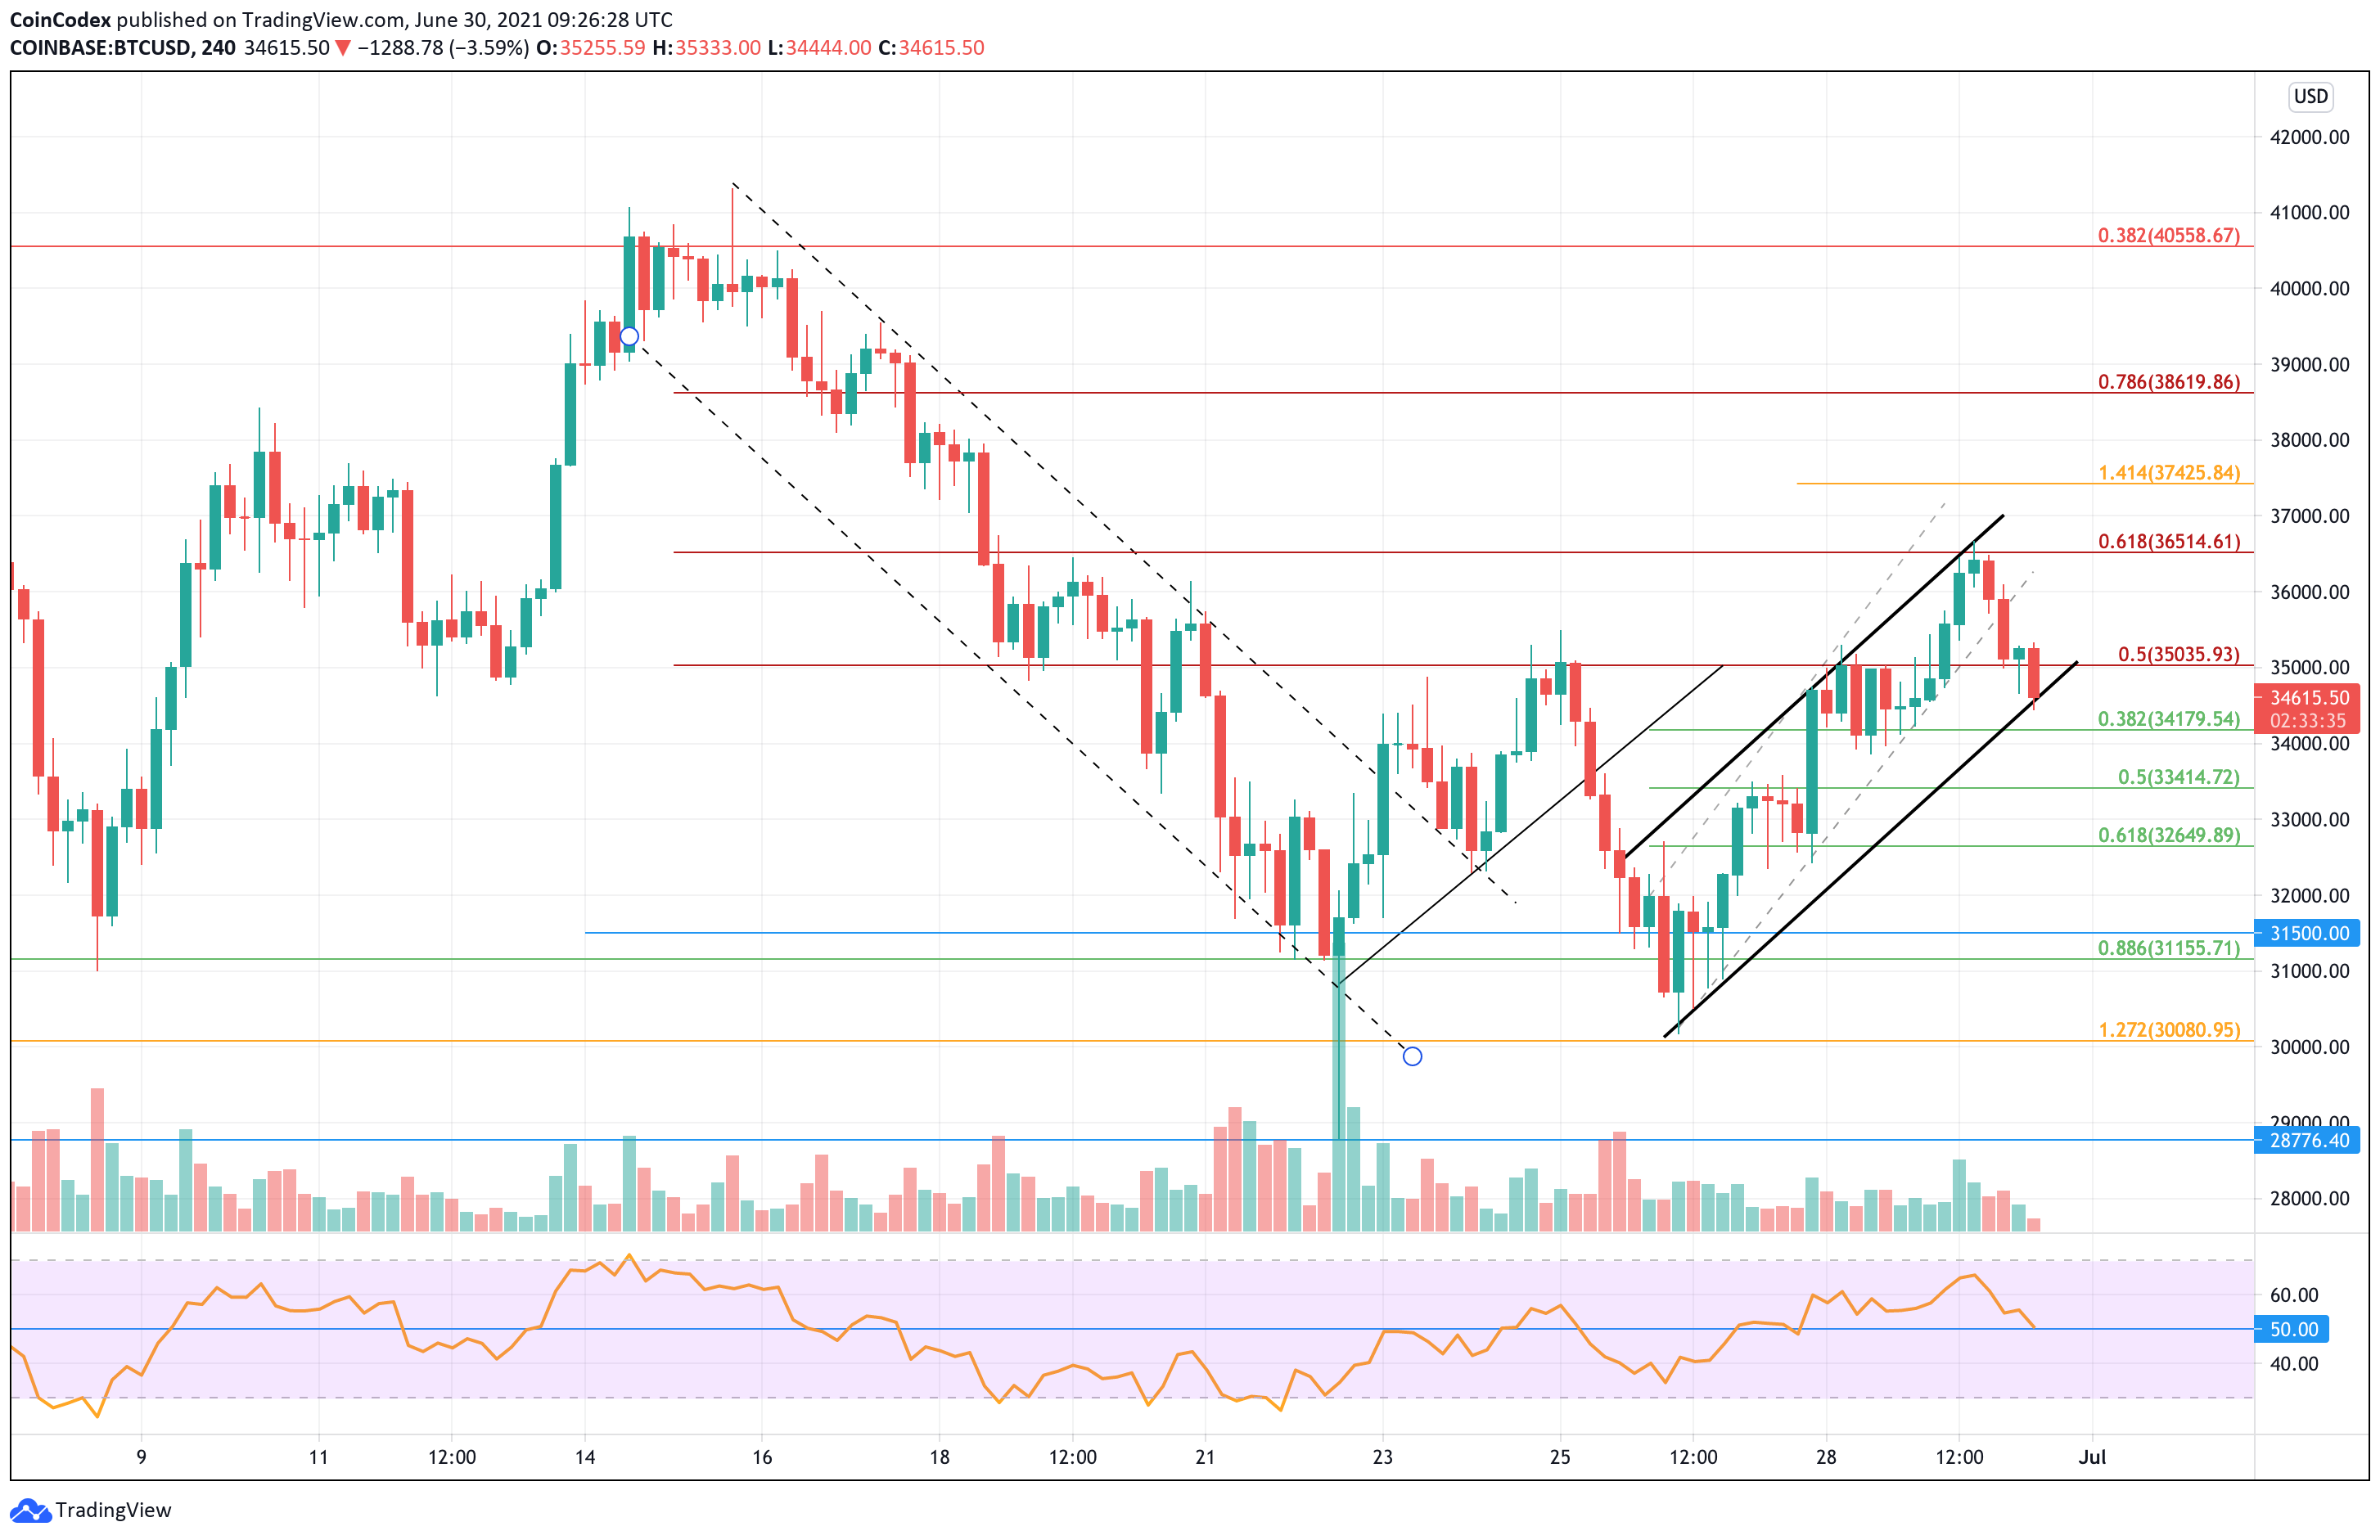
Looking at the 4-hour chart above, we can see that BTC has surged quite significantly from the low price that was seen over the weekend. It had started to surge inside an ascending price channel as it broke resistance at $35,000 that had stalled the market last week.
Yesterday, Bitcoin managed to briefly break past the $35,000 resistance (bearish .5 Fib Retracement), and it continued to push higher above resistance at $36,000. After breaking $36,000, BTC persisted to move higher to reach resistance at $36,515, provided by a bearish .618 Fib Retracement level.
Since hitting this resistance, BTC has rolled over and started to drop lower. It did break the previous short-term ascending price channel (dashed line), but a newly formed price channel has since emerged, and BTC is battling to remain above the lower boundary today.
Bitcoin price short-term prediction: Neutral
Bitcoin still remains neutral in the short-term and would have to break above resistance at $42,000 to start to turn bullish again. On the other side, a daily closing candle beneath $30,000 would be required to turn the market bearish.
Looking ahead, the first support lies at the lower boundary of the price channel. Beneath the channe, support lies at $34,180 (.382 Fib Retracement), $34,000, $34,415 (.5 Fib Retracement), $33,000, and $32,650 (.618 Fib Retracement).
If the bears continue to drive BTC lower, added support lies at $32,000, $31,500, $31,155 (.886 Fib Retracement), and $31,000.
Where is the resistance toward the upside?
On the other side, the first resistance now lies at $35,000. This is followed by $36,000, $36,515 (bearish .618 Fib Retracement), $37,000 (upper boundary of price channel), $37,425 (1.414 Fib Extension), and $38,000.
Beyond $38,000, additional resistance is found at $38,620 (bearish .786 Fib Retracement), $39,000, $40,000, and $40,560 (bearish .382 Fib Retracement level).
Keep up-to-date with the latest Bitcoin Price Predictions here.