Veteran trader Peter Brandt is highlighting one metric which might reveal whether Bitcoin (BTC) has what it takes to rally after months of market woes.
Brandt, who became a famous figure in crypto circles after correctly calling Bitcoin’s 2018 collapse, tells his 664,300 Twitter followers that it would be a positive development for BTC if the Bitcoin Dominance chart (BTC.D) manages to reach 50%.
“This chart could be the big ‘tell.’
A decisive close back above 50% would be huge positive BTC.”
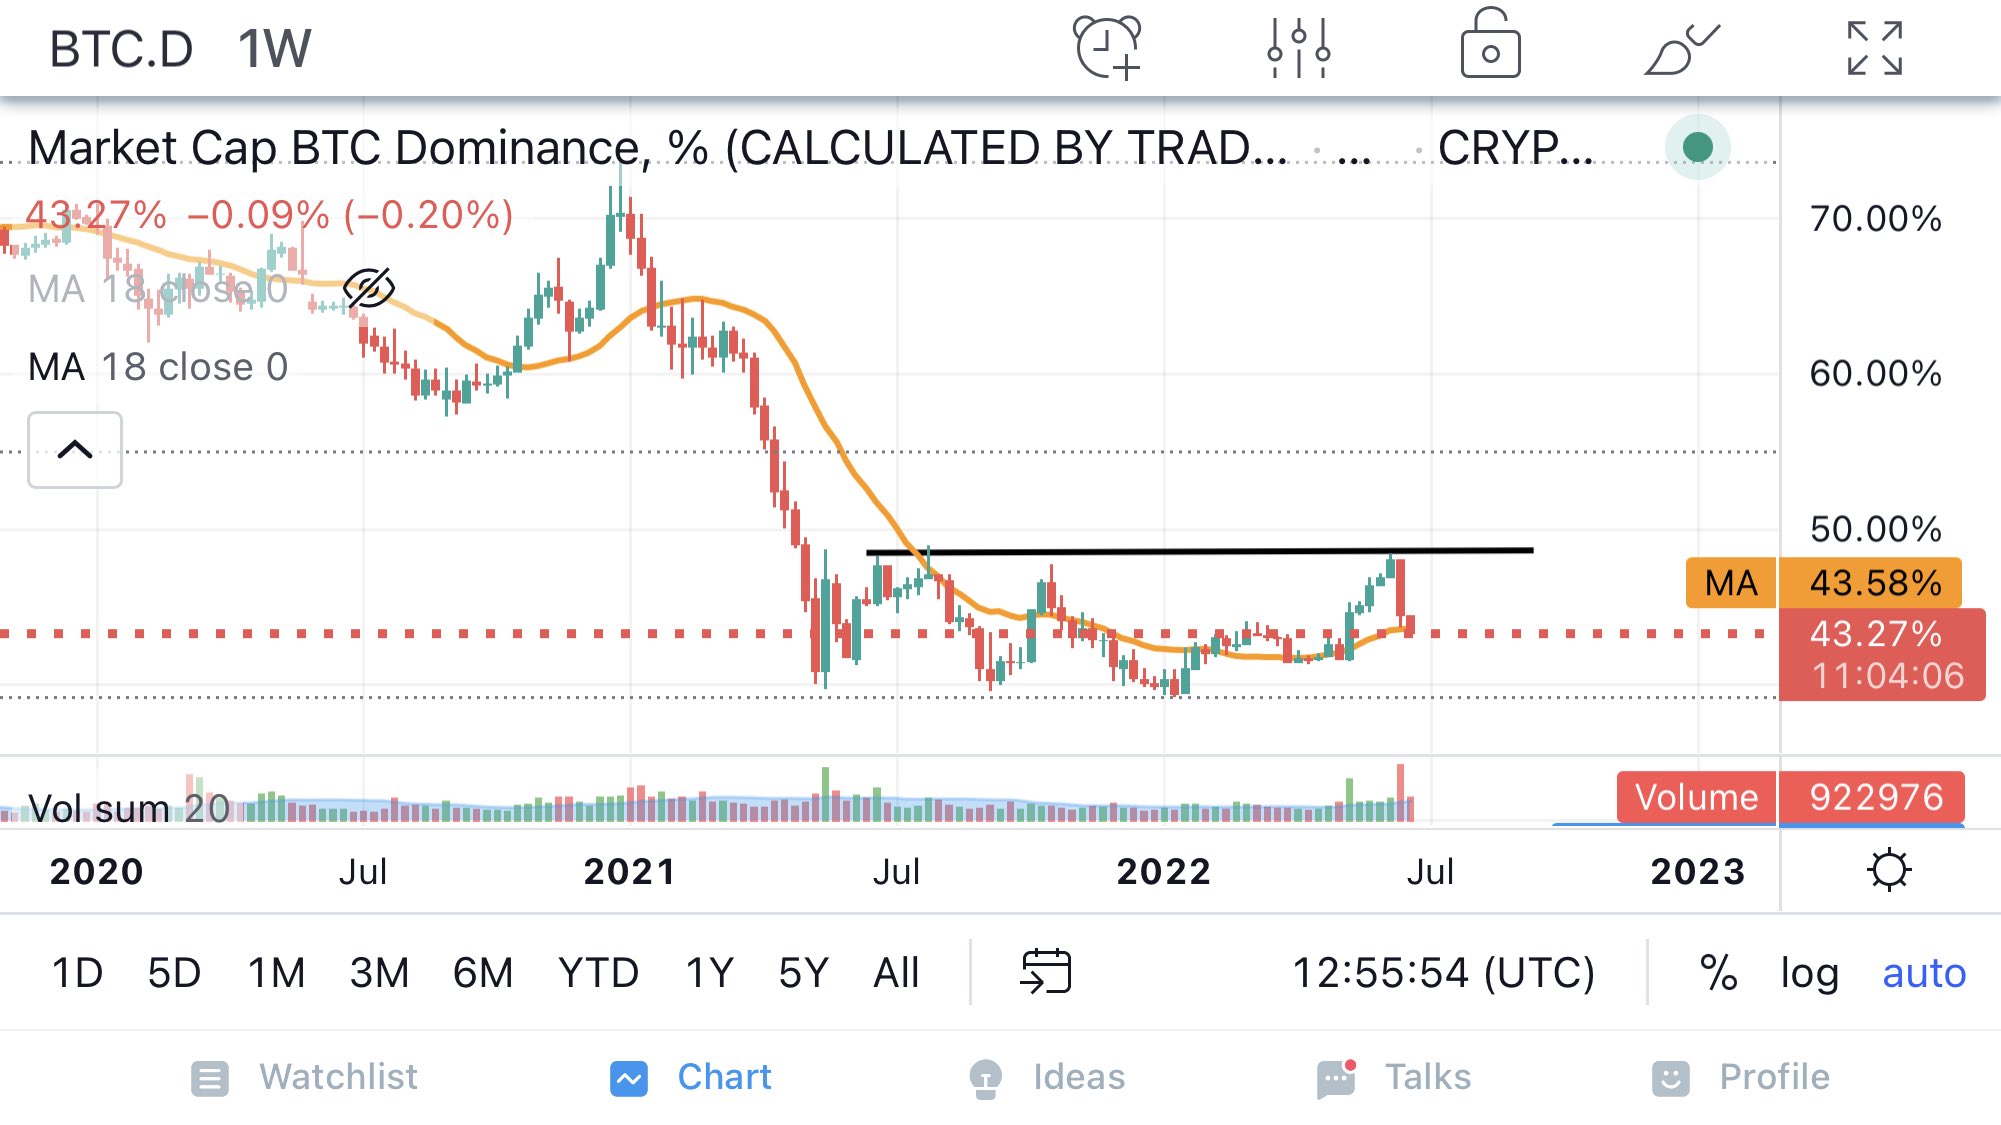
The BTC Dominance chart, which tracks how much of the total crypto market capitalization belongs to Bitcoin, has not reached 50% since July of 2021 when it bottomed out at around $30,000 before rallying to its all-time high at $69,000.
A bullish BTC Dominance suggests Bitcoin is rising faster than other crypto assets or altcoins are losing value while the leading crypto by market cap surges.
Traders view a rising BTC.D chart as a sign that investors are flying to the relative safety of Bitcoin, suggesting that most speculators have left the crypto markets.
On the other hand, a falling BTC.D suggests altcoins are gaining value faster than Bitcoin. Traders often see a bearish BTC.D chart as a signal of froth and excess speculation in the crypto markets.
In addition to his 2018 Bitcoin call, Brandt warned investors in April that the leading crypto by market cap was likely to fall below $30,000.
At time of writing, Bitcoin is down 1.75% and trading for $20,841.